
European electronic components market trends - Q3 2019
The European Distributor electronic components Total Available Market (DTAM) continued to decline in the third quarter of 2019, Adam Fletcher, Chairman of the International Distributors of Electronics Association (IDEA), has reported.
Consolidated returns from the association’s member companies reveal that average ‘Billings’ (sales revenue invoiced, less credits) declined by (7.5%) in Q3’19 when compared to the same calendar quarter 2018, sending the market into a technical recession (i.e. two consecutive quarters of decline).
The growth in the European electronic components market in the first three quarters of 2019 slowed to just (0.9%), exacerbated by manufacturer lead-time reductions for electronic components, a global economic slowdown, ongoing trade wars and Brexit. IDEA members had previously forecast stronger growth in the second half of the year but it’s clear now that this is not going to happen, but an uptick is expected in Q1’20.
Each month IDEA collates the statistical data reported by its member associations throughout Europe and consolidates the figures before publishing them as headline information. IDEA uses three primary metrics in its reporting process: ‘Billings’ (sales revenue invoiced, less credits), ‘Bookings’ (net new orders entered), and the ratio of the two known as the ‘Book to Bill’ (or B2B) ratio.
All three metrics are important, but the consolidated ‘Billings’ number is possibly the most critical value as it is the most accurate indicator of the performance of all organisations operating in the market”, says Fletcher. “Organisations are able to use this figure to compare their actual operating performance with the market’s average sales revenue performance”.
The data presented in the following graphics is shown in K€ Euros and where necessary has been converted from local currency at a fixed exchange rate for the year.
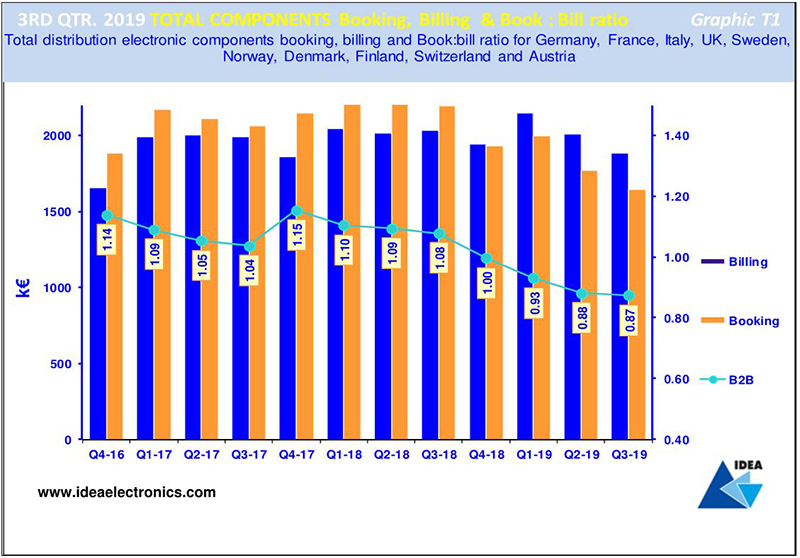
Q3’19 Bookings, Billings & B2B - Graphic T1
Graphic T1 is a visual representation of twelve quarters of ‘Billings’ and ‘Bookings’ together with the corresponding ‘Book-to-Bill’ (B2B) ratios. A positive B2B number - i.e. greater than 1 – indicates growth in electronic components markets but a number below 1 is evidence of a decline.
A quick glance at the chart suggests that there has been a decline in growth in the third quarter of 2019, an unusual outcome that does not follow either the historical precedence or IDEA member guidance. Further analysis reveals a very slight decline in the Book to Bill to 0.87:1 confirms certainty of lower growth during the last two quarter of the year and suggests it’s also likely in Q1 ’20 but this would be very unusual as the European market historically has a strong first half.
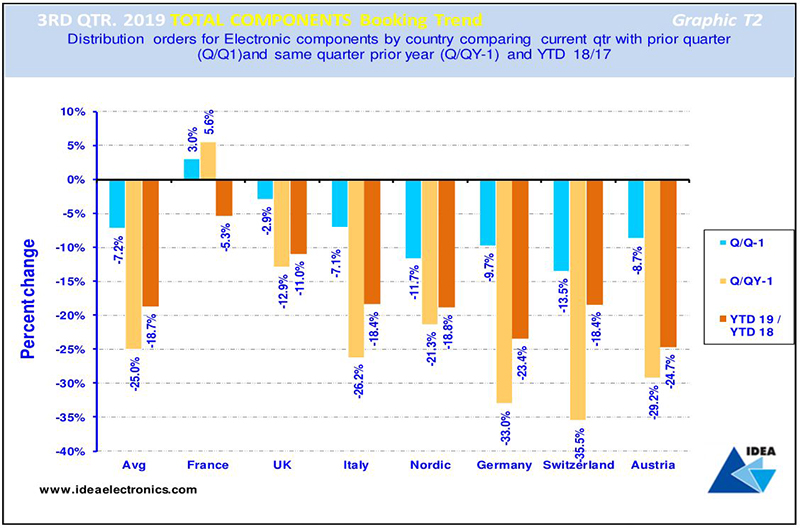
Q3 ’19 Bookings Trend - Graphic T2
Graphic T2 compares the total electronic components ‘Bookings’ result achieved by each European country in Q2'19 and contrasts and compares their returns with the previous quarter's results and those achieved in the same period last year.
The blue bar reveals that on average European ‘Bookings’ declined by (7.2%) in Q3’19 when compared to the previous quarter.
The light brown bar compares ‘Bookings’ growth by country in Q3'19 with those in the same quarter 2018 and indicates that on average ‘Bookings’ declined by (25%), which is a precipitous drop.
The dark brown bar compares average ‘Bookings’ achieved in Europe year-to-date with the same period in 2018, revealing that the average Bookings growth rate declined by (18.7%) across Europe over the 12-month period, confirming that the European market is slowing quickly.
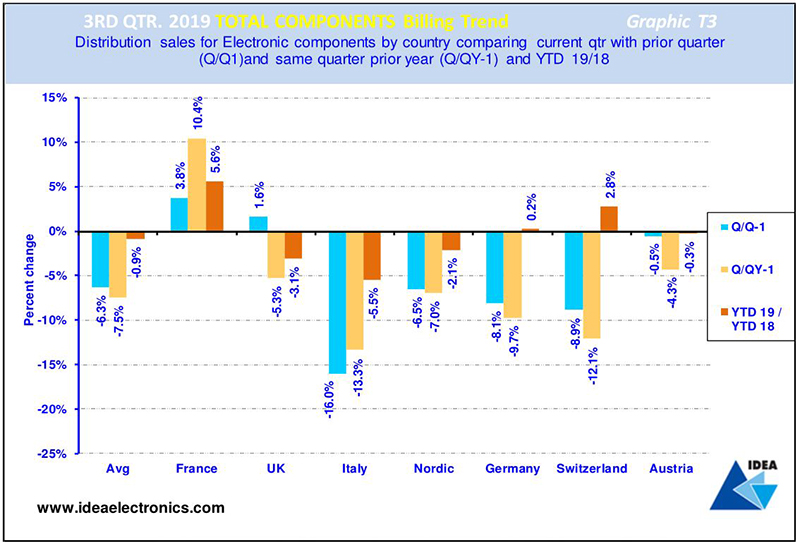
Q3 ’19 Billings Trend - Graphic T3
Graphic T3 illustrates total electronic components ‘Billings’ achieved in European markets in Q3'19 and contrasts and compares the results with the previous quarter's results and those achieved in the same period last year.
The blue bars compare Q3’19 ‘Billings’ with the preceding quarter’s figures, revealing that all European electronic components markets experienced an average decline in growth over the period, of (6.3%).
The light brown bars compare Q3’19 with the same quarter last year and shows that most European electronic components markets suffered in the quarter, with an average decline of (7.5%).
The dark brown bars compare current YTD ‘Billings’ with the same period 2018, revealing an average decline of (0.9%) across European Components Markets, which history will record as a technical recession.

Featured products

MAX17793
Analog Devices Inc.

3V to 80V, 3A, High-Efficiency, Synchronous Step-Down DC-DC Converter
| SKU: | MAX17793 |
|---|---|
| Stock: | 9316 |
| Cost: | $3.64 |

MAX22516
Analog Devices Inc.

IO-Link Data Link Controller with Transceiver and Integrated DC-DC
| SKU: | MAX22516 |
|---|---|
| Stock: | 8000 |
| Cost: | $5.42 |
Product Spotlight
102991834
BeagleBoard

Single Board Computer (SBC), BeagleY-AI
AM67A BeagleY-AI Jacinto 7 AR...
| SKU: | 2820-102991834-ND |
|---|---|
| Stock: | 186 |
| Cost: | $56.24 |
SC1110
Raspberry Pi
Raspberry Pi 5 2GB
The Raspberry Pi 5 2GB model represents a leap for...
| SKU: | 2648-SC1110-ND |
|---|---|
| Stock: | 185 |
| Cost: | $38.33 |
AKX00069
Arduino
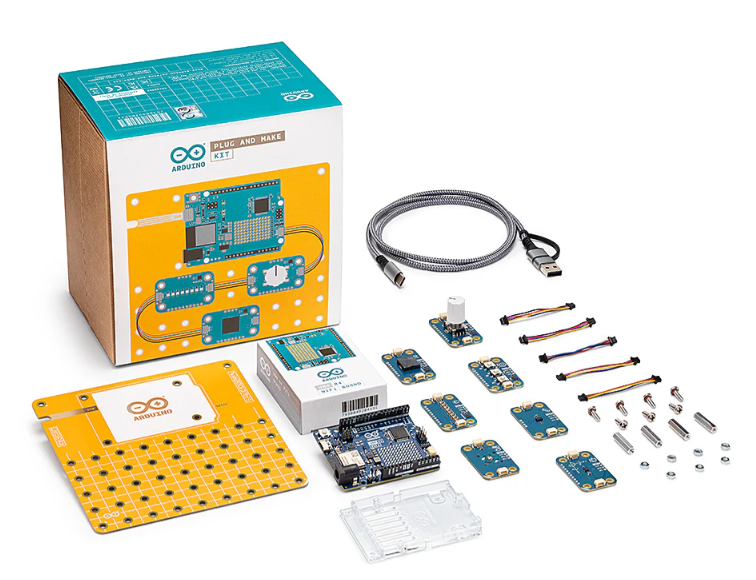
Arduino Plug and Make Kit
The Arduino Plug and Make Kit features the ...
| SKU: | 1050-AKX00069-ND |
|---|---|
| Stock: | 945 |
| Cost: | $66.97 |
300361-0011
Molex
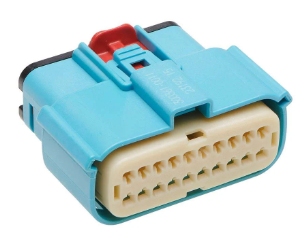
MX150 Mid-Voltage MatSealed Female Connector Assembly, Dual Row, 20 Circ...
| SKU: | |
|---|---|
| Stock: | 280 |
| Cost: | $2.51 |