


In his quarterly Statistical Review of the European electronic components market the association’s chairman Adam Fletcher, describes the current European market situation for readers of Electronic Specifier using three primary reporting metrics – ‘Bookings’ (net new orders entered), ‘Billings’ (sales revenue invoiced, less credits), and the ratio of the two known as the ‘Book to Bill’ (or B2B) ratio.
The first quarter of the year has historically been the strongest growth period for European electronic components markets and the feeling among IDEA members was that the trend would continue in the current year. They were correct, but their performance in Q1’22 was much stronger than anyone predicted, although concerns abound that much of the growth could be put down to customers pulling forward inventory to avoid the uncertainty and risk occasioned by the current geopolitical tensions.
In the short-term at least I’m confident that the highly competitive nature of the global electronic components markets will ensure that customer demand will continue to be met, but if an ‘overshoot’ triggers an oversupply situation then the European electronic components supply network could be in for a different, difficult business problem next year.
Consolidated Bookings and Billings figures, together with corresponding Book-to-Bill (B2B) ratios are extremely useful metrics for organisations in the European electronic components supply network, but the consolidated ‘Billings’ (sales revenue invoiced, less credits) number is possibly top of the list for manufacturer authorised distributors, as it’s an accurate indicator of the average sales revenue performance in the sector.
Note that in the graphics included in this review all figures are shown in K€ Euros and where necessary have been converted from local currencies at a fixed exchange rate for the year.
Overall Q1‘22 Bookings, Billings & B2B trends
European “Book to Bill” continues to decline but remains in strong positive territory
Graphic T1 is a visual representation of twelve consecutive quarters of consolidated European ‘Bookings’ and ‘Billings’, together with the corresponding B2B ratios. A B2B figure greater than 1 is indicative of growth in electronic components markets, but a number below 1 is evidence of a decline.
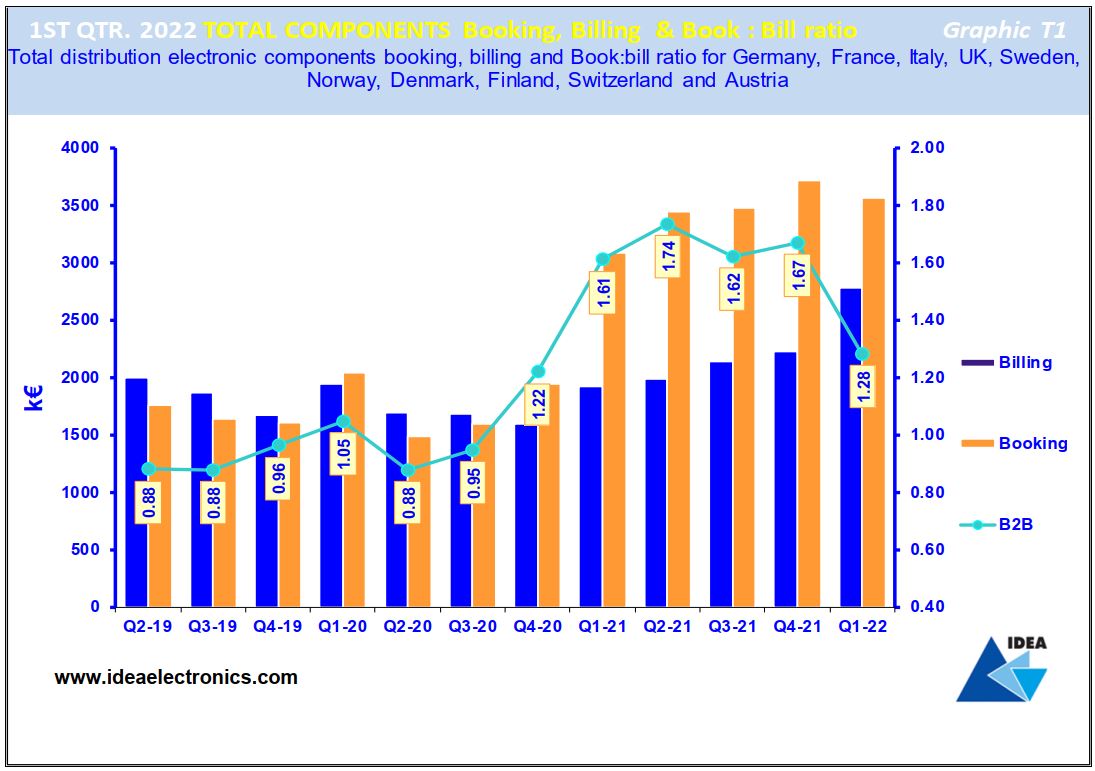
The chart reveals declining growth in ‘Bookings’ in Q1’22 whilst Billings continued to grow. The B2B ratio is generally keeping pace: It grew from around “unity” pre. Q4’20 to 1.22:1, and later to 1.59:1. The leap to 1.73:1 in Q2’21 preceded a slight decline to 1.62:1 in Q3‘21, with a further slight decline in Q4’21to 1.59:1. The further decline to 1.28:1 in Q1’22 is strongly indicative that ‘Bookings’ growth has probably peaked in the current cycle.
Q1‘22 Bookings trend
European bookings continue to decline
Graphic T2 compares the total electronic components ‘Bookings’ result achieved in Q1’22 by manufacturer authorised distributors in each European country and contrasts and compares these figures with the results they achieved in the preceding quarter and in the same period in the previous year.
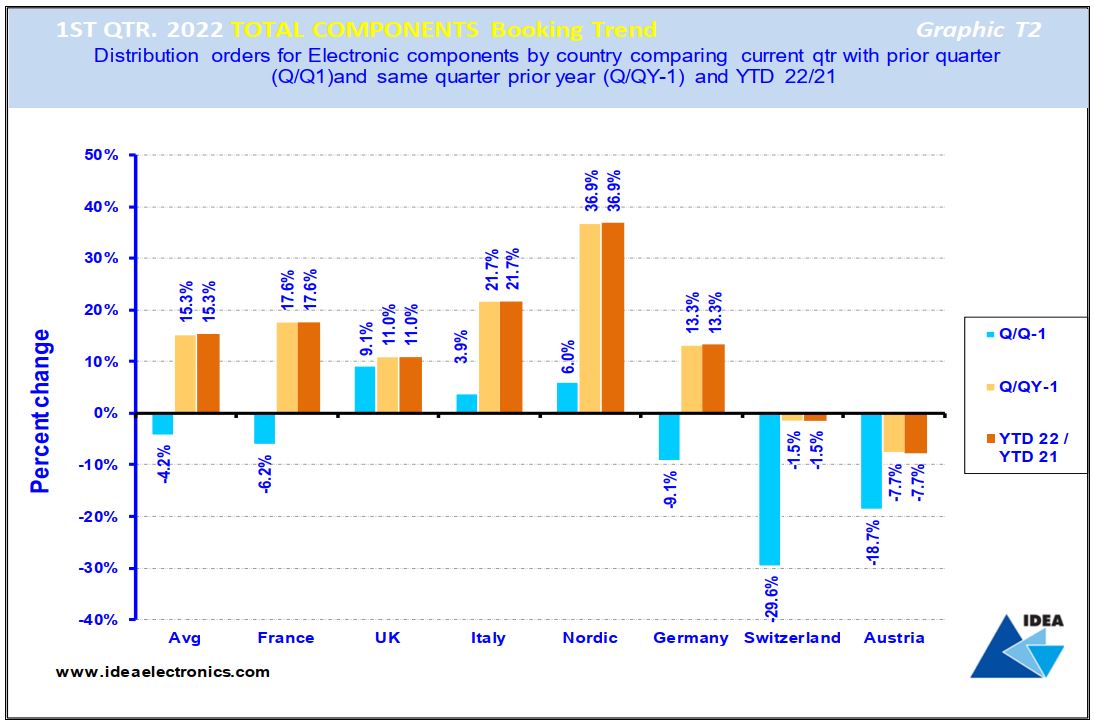
The blue bar reveals that on average, ‘Bookings’ reported by IDEA member companies declined by (4.2%) in Q1‘22 when compared to the previous quarter. The light brown bars compare Q4’21 ‘Bookings’ figures achieved in each country with those reported for the same quarter 2021 and indicate that on average, European ‘Bookings’ grew by 15.3% year-on-year.
The dark brown bar compares average ‘Bookings’ achieved in Europe YTD (year-to-date) with the same calendar point 2021, revealing that the average European ‘Bookings’ growth rate increased by 15.3% over the 12-month period. This strongly suggests that peak ‘Bookings’ growth has been passed and a decline should be expected as manufacturer lead-times start to ‘normalise’ and customers begin the process of reducing their supplier order cover (Backlog).
Q1’22 Billings trend
European Billings, exponential growth in the electronic components supply network
‘Billings’ figures are widely considered to be the key industry metric: Graphic T3 illustrates total electronic components ‘Billings’ achieved by IDEA member companies across Europe in Q1’22 and contrasts and compares the figures with the previous quarter’s results and those achieved in the same period last year.
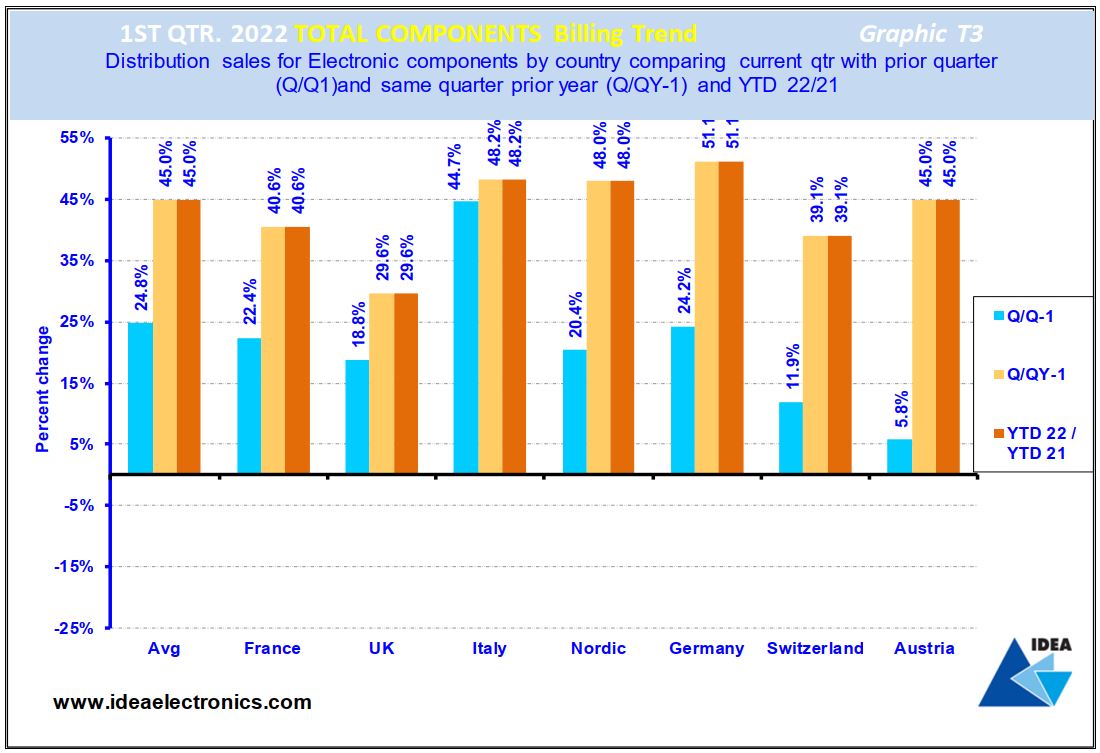
The dark brown bars in the chart compare current ‘Billings’ with the same point 2021, confirming an average increase of 45% YTD across the European electronic components supply network.
The blue bars reveal that European electronic components markets experienced an average growth of 24% in Q1‘22 compared to the previous quarter, whilst the light brown bars compare Q1‘22 to the same quarter 2021. It’s apparent from these comparisons that the European electronic components supply network grew by an astonishing 45% in the three months, which by any measure is a very creditable performance, particularly given the current political and economic turmoil. Manufacturers of electronic components and the authorised distributors who represent them are making record shipments to customers, evidence that the enhanced collaboration that we are currently seeing throughout the electronic components supply network has a major part to play in solid business practice.