
Distributor ‘association of associations’ report strong but declining European billing performance in Q2’23
Each month the International Distribution of Electronics Association (IDEA) collates the statistical data returned by its member associations throughout Europe and publishes the consolidated figures as headline information.
In his quarterly Statistical Review of the European electronic components market the association’s Chairman, Adam Fletcher, describes the current European market situation for readers of Electronic Specifier using three primary reporting metrics – ‘Bookings’ (net new orders entered), ‘Billings’ (sales revenue invoiced, less credits), and the ratio of the two known as the ‘Book-to-Bill’ (or B2B) ratio.
European electronic component markets historically experience their strongest Booking and Billing growth in the first half of the year. Whilst Billings continued to grow strongly In Q2’23 compared to the same period last year, Bookings (and thereby Backlogs) are today rapidly declining as OEMs realign their order cover and in-house inventory levels with current component manufacturers’ lead-times. The two figures are compared to arrive at the Book-to-Bill (B2B) ratio: A B2B greater than 1 is indicative of growth in electronic component markets but a number below 1 is evidence of a decline. All the figures are extremely useful metrics for organisations in the European electronic components supply network, but the consolidated ‘Billings’ (sales revenue invoiced, less credits) number is probably the most useful for manufacturer authorised distributors of electronic components, as it’s an accurate indicator of their sector’s average sales revenue performance. Note that all the figures in the graphics included in this review are shown in K€ Euros and where necessary have been converted from local currencies at a fixed exchange rate for the year.
Overall Q2‘23 Bookings, Billings & B2B trends
European B2Bs decline rapidly as order backlogs continue to decrease
Graphic T1 is a visual representation of twelve consecutive quarters of consolidated ‘Bookings’ and ‘Billings’ together with the corresponding B2B ratios.
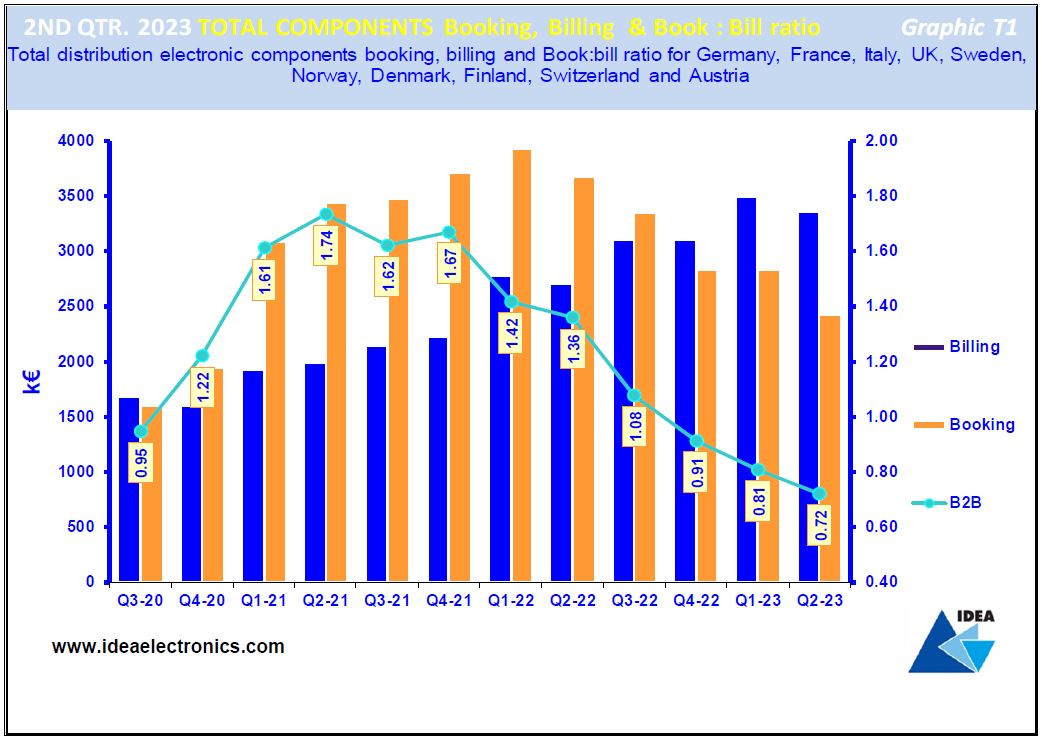
The chart reveals that growth in ‘Bookings’ continued to decline in Q2’23 compared to the previous quarter and that ‘Billings’ are now starting to follow the trend in-line with longer term historical trends. The B2B ratio continues to steadily retreat: It hit 0.72:1 (highly negative territory) at the end of Q2’23 from a peak of 1.74:1 (outrageously positive) in Q2’21, strongly indicating that OEM customers are continuing to ‘wind down’ their order backlogs.
Q2‘23 Bookings trend
European ‘Bookings’ continued to decline as predicted by IDEA members
Graphic T2 compares the total electronic components ‘Bookings’ result achieved in Q2’23 by manufacturer authorised distributors in each European country and compares these figures with the results they achieved in the preceding quarter and in the same period in 2022.
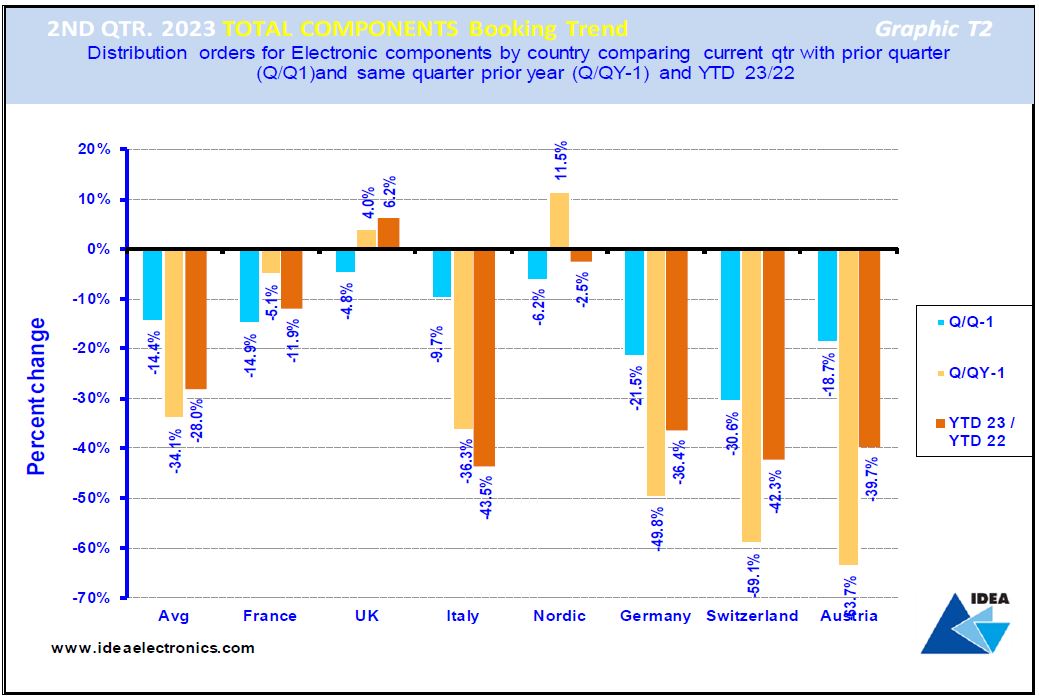
The blue bar reveals that on average, ‘Bookings’ in Europe declined by (14.1%) in Q2‘23 compared to the previous quarter. The light brown bars compare Q2’23 ‘Bookings’ figures achieved in each country with those reported for the same quarter 2022 and indicate that on average, European ‘Bookings declined by (34.1%) year-on-year. The dark brown bar compares average ‘Bookings’ achieved by European manufacturer authorised distributors year-to-date, revealing that the average ‘Bookings’ growth rate declined by a further (28%) over the twelve-month period.
It’s apparent that ‘Bookings’ growth peaked in Q1’22 before entering a period of decline spanning the third and fourth quarters of 2022 and into 1H’23. This trend is widely expected to continue into 2H’23 as components manufacturer lead-times ‘normalised’ and customers begin the process of reducing their supplier order cover and in-house inventory accordingly, but growth is however predicted to return in 1H’24.
Q2’23 European Billings trend
Strong ‘Billings’ growth in the European electronic components supply network continues
Graphic T3: ‘Billings’ figures are widely considered to be the key industry metrics.The graphic illustrates total electronic components ‘Billings’ achieved by IDEA member companies across Europe in Q2’23 and compares the figures with the previous quarter's results and thoseachieved in the same period last year.
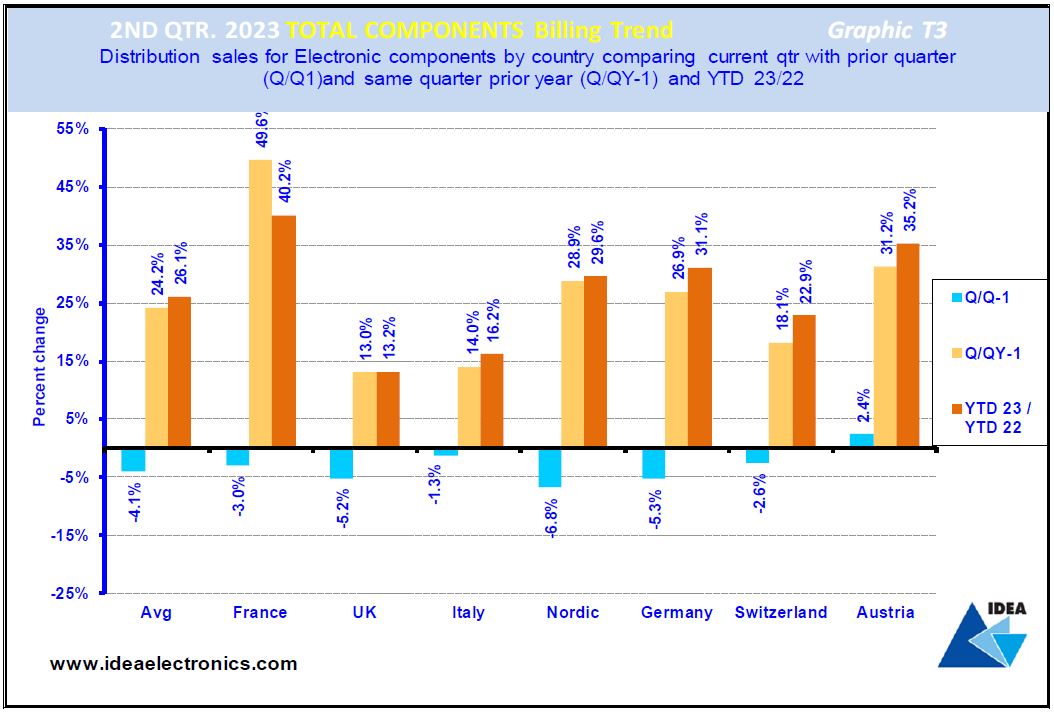
The blue bars reveal that European electronic components markets experienced an average decline of (4.1%) in Q2‘23 when compared to the previous quarter. The light brown bars compare Q2‘23 to the same quarter the previous year and reveals that on average ‘Billings’ grew by 24.2% in the quarter. The dark brown bars in the chart compare current ‘Billings’ with the same point 2022, confirming an average increase of 26.1% year-to-date across the European electronic components supply network.
Concluding thoughts
Despite exceptional political and economic turmoil, improvements in component supply and international logistics helped manufacturers of electronic components and their authorised distributors to continue making record shipments to OEM customers in Europe, boosted in no small part by enhanced collaboration levels that reach right across the electronic components supply network. It’s vital for all organisations that the ‘equilibrium phase’ continues to progress but sadly it’s likely to prove problematic for some as they strive to adapt to the new reality.
Product Spotlight
APV1111GVY
Panasonic

Panasonic PhotoMOS® Photovoltaic MOSFET High-Power Drivers
| SKU: | |
|---|---|
| Stock: | 3490 |
| Cost: | $3.95 |
