


Guest Blog: By Ron Stull, Power Systems Engineer, CUI.
Real and apparent power
η = POUT/PIN and for an AC-DC converter, POUT is simply the DC output voltage multiplied by current. For the AC input power though, if we measure and multiply ac rms volts and amps, we get an ‘apparent’ power (S).
This is different to the real power (P) consumed and is related by the term ‘Power Factor’ (PF) where PF = P/S. So why is the apparent power different? It would not be if the input of the AC-DC converter looked like a resistor and the voltage and current waveforms were both sine waves and in phase, but this is not the case.
The triangle of power
Engineering classes raise the subject and discuss the issue of power factor in linear systems where voltage and current are sine waves but with a phase difference ϴ. In this case, power factor, or more correctly displacement power factor PFD, is given by the cosine of the phase angle so that PFD = Cosϴ. You can represent this with the power triangle (Figure 1). Here S is what you measure as rms volts x amps (VA) and, because of the phase angle difference ϴ, this is represented by a real power P and a reactive power Q.
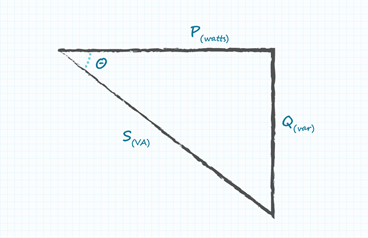
Figure 1. Power triangle for a linear system
However, in an AC-DC converter, the current (and often the voltage) waveform is far from sinusoidal, with current taken in short pulses by the bulk capacitor on the converter high voltage bus as it is topped up at the peak of each mains cycle (Figure 2). This is the characteristic of a non-linear system.
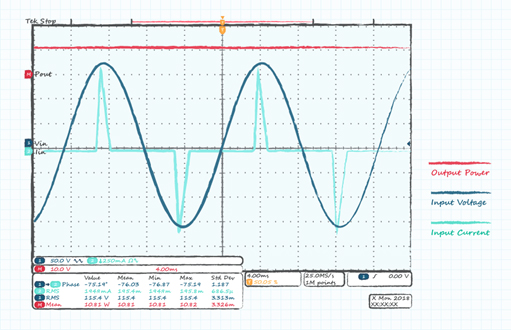
Figure 2. Typical AC-DC input voltage and distorted current
To represent this in our power triangle, we need to include another dimension of ‘distortion’ power factor (Figure 3).
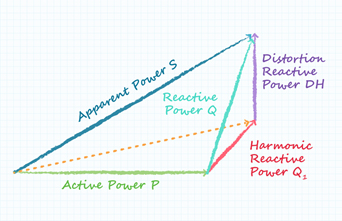
Figure 3. Power triangle for a non-linear system
The true value of power
Fourier analysis shows that the current waveform can be represented by a fundamental frequency, nearly in phase with the voltage, with a series of harmonics at different amplitudes added to form the distorted current waveform. It is these harmonics that spoil the power factor and are quantified by the Total Harmonic Distortion (THD). To put a value to it:

Distortion Power Factor DPF is:

If THD were zero, you can see that DPF would be 1 as would be the case in a linear system. The true power factor TruePF for our AC-DC converter input is now:

Power analysers make it easy
With such complications, it might seem daunting to measure true power and efficiency, but, in practice, commercial power analysers do the hard work for you. A typical power analyser will output real and apparent power, power factor, THD and the current in each harmonic (Figure 4). While knowing efficiency is vital, there is an international standard EN61000-3-2 that actually puts limits to harmonic emissions, up to the 39th harmonic.
These are absolute limits, so they are generally not a concern for low power external adapter-type AC-DC converters. Higher power converters, however, need internal power factor correction circuitry to comply with the standard but still leave residual harmonic distortion that must be accounted for in efficiency calculations.
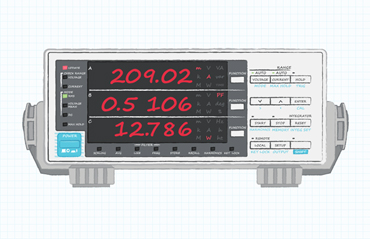
Figure 4. A typical power analyser
The value of a power analyser can be seen if you attempt to estimate power factor with an oscilloscope. Looking at the typical scope plot in Figure 2 one can see that the phase measurement function is showing a phase difference between the voltage and current of around 70° which clearly does not look right.
The peak of the voltage and current are only a few degrees apart, 5° in this example, giving a PF of 0.996 from our previous equations. This confirms that the displacement power factor is close to unity and it is the distortion power factor that is the main feature.
Allowing for power factor when determining efficiency is not just to score an extra percentage or two; PF can easily be as low as 0.5 at the rated load of a converter, meaning that apparent power is twice that of real power. Even the best performing converter with an efficiency approaching 100% would indicate no more than 50% without PF considered.
Real power also has to be evaluated under different line and load conditions to show compliance with efficiency standards such as DoE Level VI, which requires values at 25%, 50%, 75% and 100% load at high and low line voltages. PF effects are quite different over these ranges.
The real world
As a real world example, look at the measurements below, which were obtained from a 240W power supply operating at 24W.
Measurements:
Vin = 220V
Iin = 0.16A
PF = 0.78
POUT = 24.0W
From the values, we see a volt-ampere product for the input, S = Vin x Iin = 35.3 VA. If we were to ignore power factor, we would calculate an efficiency of 68% (24.0W / 35.3VA).
If we include power factor, we see a lower input power PIN = S x PF = 27.53W. Using this value, we get an efficiency of 87%, nearly 20% better.
Accuracy is key
Efficiency is key to all power converter designs for size, cost and energy savings, with regional efficiency regulations such as DoE Level VI setting the bar ever higher.
The difference between the best designs from competing suppliers is shrinking as well, meaning that to compare and qualify parts, accurate efficiency measurement is vital. Full account needs to be taken of the effects of power factor and harmonic current distortion of line current. Power analysers make this easy and put you on the right track toward proper measurements.