


Dependability is a combination of several factors, including reliability, and this is designed-in through careful attention to detail. Brand reputation is not the only aspect to benefit from proper design for reliability.
Valuable savings can also be gained throughout the product life cycle by reducing burdens such as design changes, re-testing, field repairs and warranty claims. There are multiple ‘wins’ for the taking, but where to start?
Reliability basics
Let’s begin with a proper definition of reliability, outlined below. We will then address a common misunderstanding before finally moving on to how we can assess and design for reliability in order to achieve the best possible results.
The reliability of any given product is the probability that an individual unit, operating under specified conditions, will work correctly for a specified length of time.
From this statement, it is quite clear that reliability is a statistical concept and it can be expressed mathematically as:
R(t) = e–λt
In reliability engineering, the expression is related to the Weibull distribution (figure 1), where β (Weibull slope factor) is 1 and thus excludes early failures (infant mortality: β < 1, i.e. failure rate decreasing with time) and wear-out failures (end of life: β > 1, i.e. failure rate increasing with time).
Hence R(t) = e–λt gives the probability of failure in the central region of the well-known bathtub curve (figure 2), and λ is the intrinsic failure rate of the system.
Figure 1. Two-parameter Weibull distribution (η is a scaling factor).
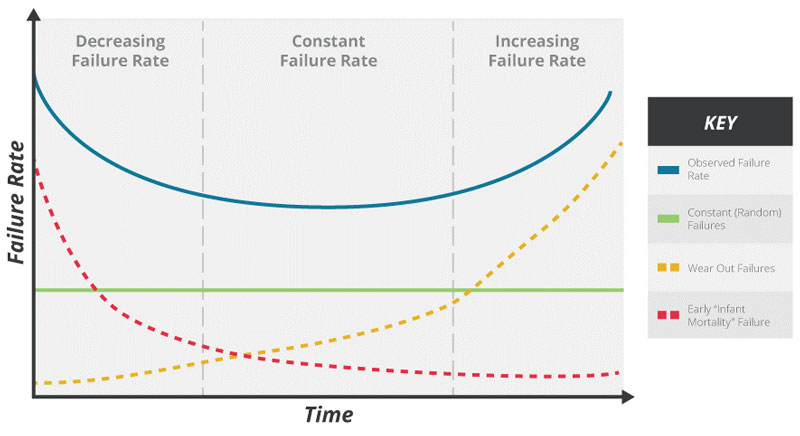
Figure 2. The bathtub curve illustrates the product lifecycle in terms of early failures, random failures and wear-out failures.
The inverse of λ, 1/λ, is the Mean Time To Failure (MTTF). In the power industry, this is often expressed as Mean Time Between Failures (MTBF).
An important truth about MTBF
A common mistake is to assume that the MTBF is a direct expression of the expected lifetime of an individual product. This is not the case, and we can see this quite clearly if we analyse the R(t) = e–λt curve (figure 3):
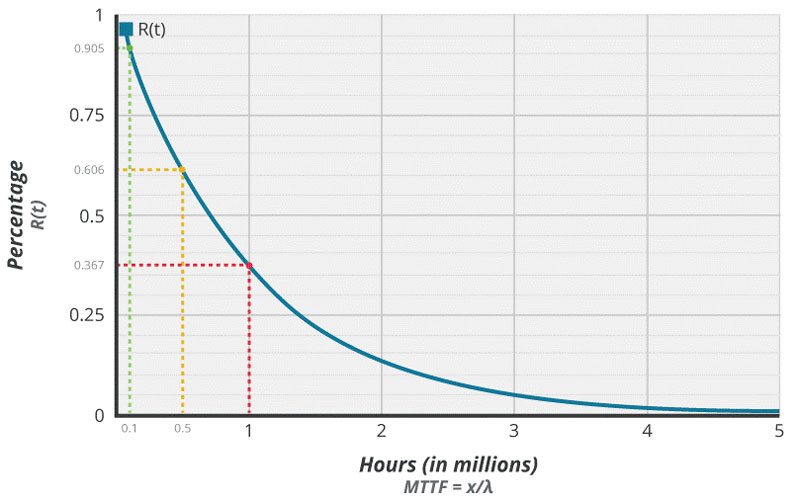
Figure 3. The probability that a component will operate for its entire MTBF is only 33.67%.
If a component manufacturer states the MTBF of a part as being, say, one million hours, its intrinsic failure rate, λ, is 10-6 failures per hour. The R(t) curve shows that only 36.7% of units are statistically expected to operate for this long. Further, 9.5% of them can be expected to fail within 100,000 hours, and 59.4% within 500,000 hours.
Remember that, so far, this analysis has only applied to a single component. To find the reliability for an entire system the individual failure rates of all the components in that system must be summed to give an understanding of the overall reliability of the product.
λA = λ1n1 + λ2n2 + … + λini
From this expression, we can observe that:
- The overall system reliability cannot be greater than its weakest component. Hence design engineers can quickly increase reliability by focusing on weaker components, perhaps by guarding against failure, for example, with extra cooling or by specifying higher quality parts for those specific locations.
- Calculating reliability for a system containing more than just a handful of components can quickly become a complex challenge. In practice there are multiple aspects to consider, including the different behaviors of components under certain operating conditions.
Fortunately, there are a number of standardised approaches to calculating reliability, and software tools are also available to help. Among the most commonly used standards, or reliability handbooks, in the electronics industry are Telcordia SR-332 and MIL-HBK-217. Others include IEC TR 62380, which is based on French telecommunications standards, and the Chinese GJB handbooks.
Each standard has various ways of modeling component behavior and applying reliability calculations. Depending on the components used in any given product, as well as the applications of the product and its operating environment, one standard may provide a more accurate reliability prediction than another.
By comparing predictions with accumulated field data, product manufacturers can apply the standard judiciously to ensure true-to-life reliability predictions for new products. CUI typically uses Telcordia SR-332 or MIL-HBK-217 handbooks to calculate MTBF for power supply products, including external power adapters and chassis-mount ac-dc power supplies.
Conclusion
Understanding reliability principles, prediction techniques and approaches to Design for Reliability – including how to focus engineering effort and budget on the weaker components – can give engineers new ways to differentiate their products against others in the market.
Additional Resources
View more information about reliability and selecting power supplies for your products.
Read more helpful How To articles on Thermal Management, Power, Interconnect, Audio and Motion Control from the CUI Insights Blog.