


In his quarterly statistical review of the European electronic components market the association’s Chairman Adam Fletcher, describes the current European market situation for readers of Electronic Specifier using three primary reporting metrics – ‘Bookings’ (net new orders entered), ‘Billings’ (sales revenue invoiced, less credits), and the ratio of the two known as the ‘Book to Bill’ (or B2B) ratio.
Historically, European electronic components markets show their strongest growth in the first half of the year and IDEA members were confident that the trend would continue in the current year. They were proved correct, and growth has continued into the second quarter, but at a much stronger rate than they predicted. Strong demand is being driven by customer uncertainty resulting from current geopolitical tensions, ongoing logistics delays, extended components manufacturer lead-times and a rapidly changing macro-economic environment. Pundits believe that electronic components manufacturing lead-times have peaked in the current cycle and have now begun to decline as supply catches up and begins to exceed supply. Given the outcome of previous comparable cycles, this situation looks very likely to result in a glut.
Consolidated Bookings and Billings figures, together with corresponding Book-to-Bill (B2B) ratios are extremely useful metrics for organisations in the European electronic components supply network, but the consolidated ‘Billings’ (sales revenue invoiced, less credits) number is possibly top of the list for manufacturer authorised distributors, as it’s an accurate indicator of the average sales revenue performance throughout the sector. Note that in the graphics included in this review all figures are shown in K€ Euros and where necessary have been converted from local currencies at a fixed exchange rate for the year.
Overall Q2‘22 Bookings, Billings & B2B trends – European “Book to Bill” continues to decline but remains in strong positive territory
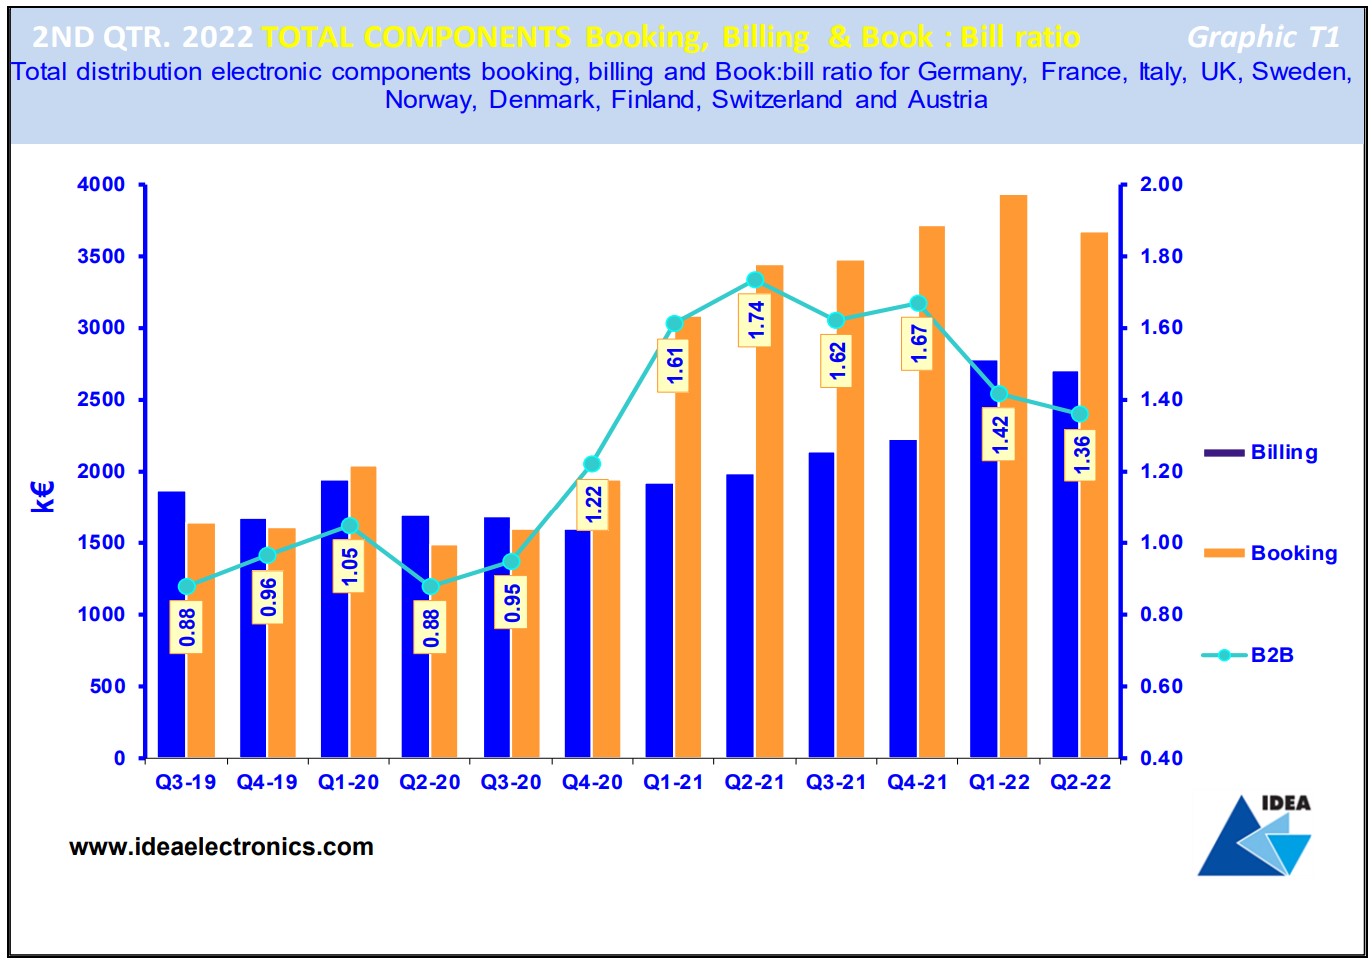
Graphic T1 is a visual representation of twelve consecutive quarters of consolidated European ‘Bookings’ and ‘Billings’, together with the corresponding B2B ratios. A B2B figure greater than one is indicative of growth in electronic components markets, but a number below one is evidence of a decline.
The chart reveals declining growth in ‘Bookings’ and ‘Billings’ in Q2’22 when compared to the previous quarter.
Note that the B2B ratio has also declined from its peak of 1.74: 1 in Q2’21 and stood at 1.36:1 at the end of Q2’22, suggesting a build-up of order backlogs which are likely to decline as we move into the second half of the year.
Q2 ‘22 Bookings trend – European bookings continue to decline
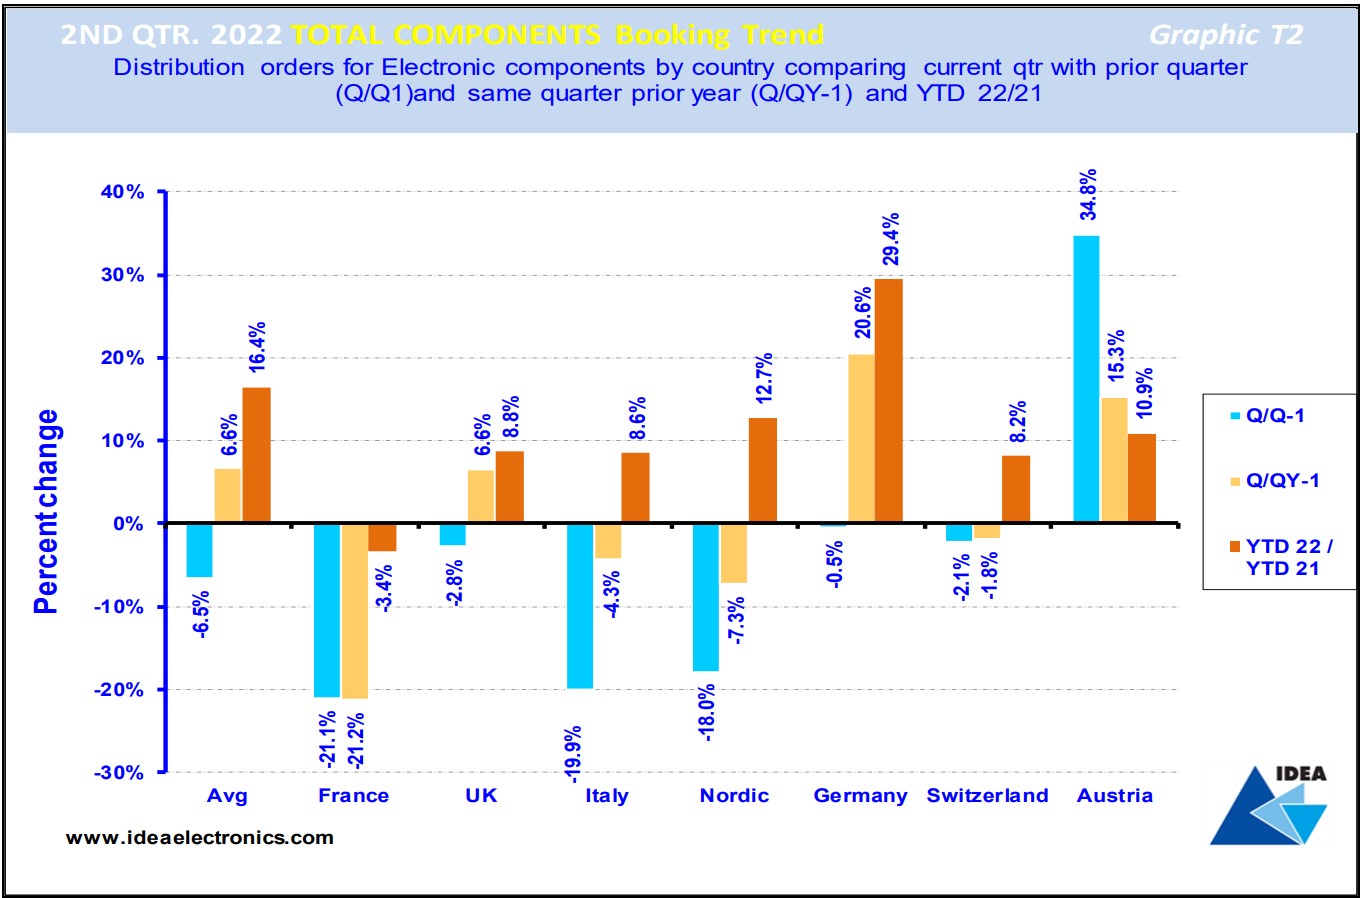
Graphic T2 compares the total electronic components ‘Bookings’ result achieved in Q2’22 by manufacturer authorised distributors in each European country and compares these figures with the results they achieved in the preceding quarter and in the same period last year.
The blue bar reveals that on average, ‘Bookings’ reported by IDEA member companies declined by (6.5%) in Q2‘22 when compared to the previous quarter. The light brown bars compare Q2’22 ‘Bookings’ figures achieved in each country with those reported for the same quarter 2021 and indicate that on average, European ‘Bookings’ grew by 6.6% year-on-year.
The dark brown bar compares average ‘Bookings’ achieved by European manufacturer authorised distributors YTD (year-to-date) with the same calendar point 2021, revealing that the average ‘Bookings’ growth rate increased by 16.4% over the twelve-month period. It’s apparent that peak ‘Bookings’ growth has now been passed and we should expect a decline over the next few quarters as manufacturer lead-times start to ‘normalise’ and customers begin the process of reducing their supplier order cover.
Q3’22 European Billings Trend – Exponential Billings growth in the European electronic components supply network
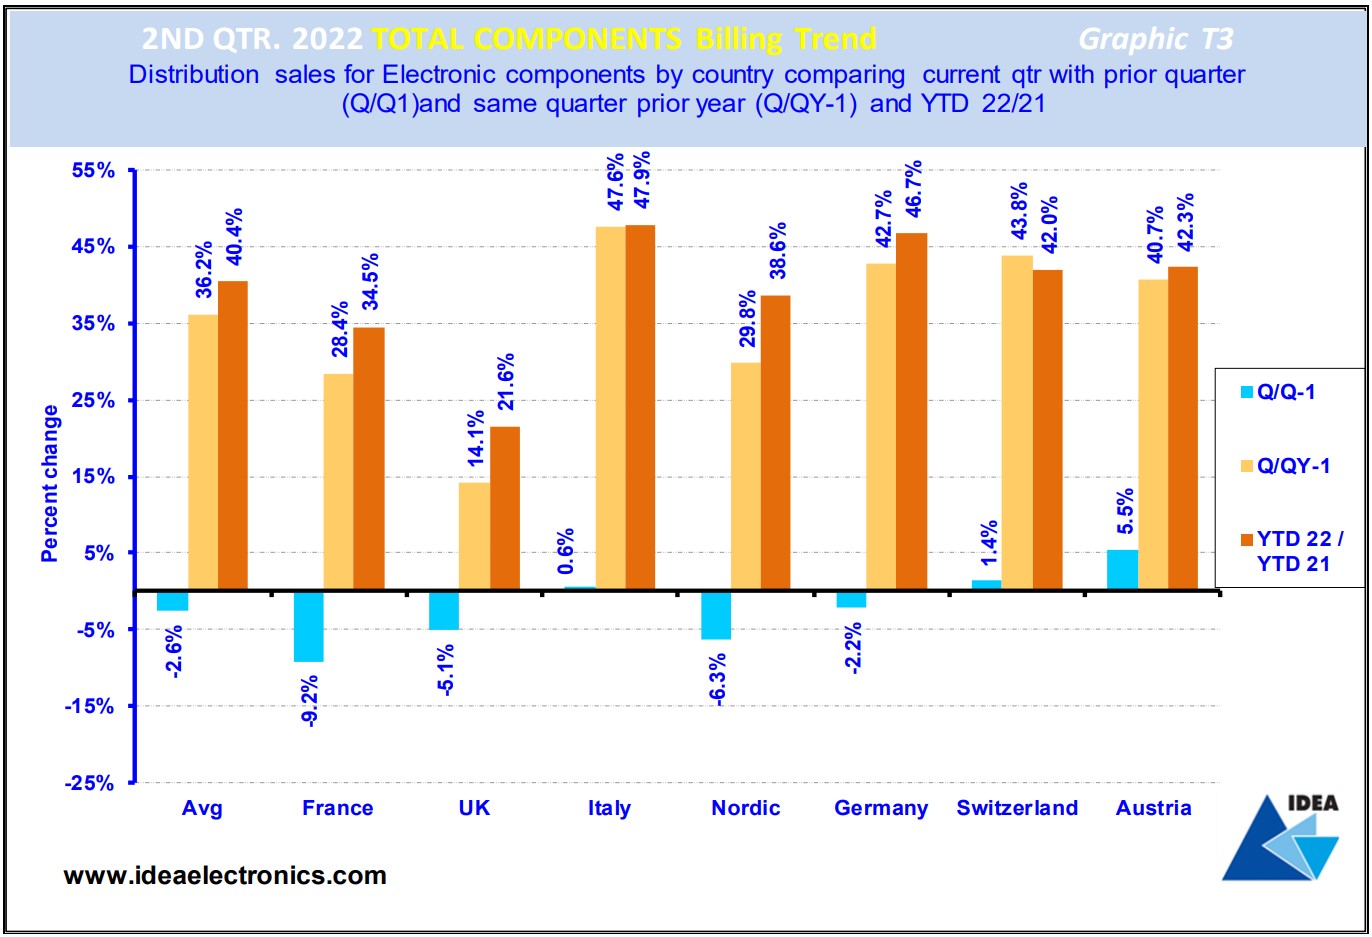
‘Billings’ figures are widely considered to be the key industry metric: Graphic T3 illustrates total electronic components ‘Billings’ achieved by IDEA member companies across Europe in Q1’22 and contrasts the figures with the previous quarter’s results, and those achieved in the same period last year.
The blue bars reveal that European electronic components markets experienced an average decline of (2.6%) in Q2‘22 when compared to the previous quarter.
The light brown bars compare Q2‘22 to the same period 2021 and reveals an average ‘Billings’ growth of 36.2% in the quarter. The dark brown bars in the chart compare current ‘Billings’ with the same point 2021, confirming an average increase of 40.4% YTD across the European electronic components supply network.
Concluding thoughts
Despite exceptional political and economic turmoil and continuing COVID-caused logistics delays, manufacturers of electronic components and the authorised distributors who represent them continue to make record shipments to their European customers. This can be attributed in no small part to enhanced collaboration levels that reach right across the electronic components supply network, a trend that must continue to proliferate as the market moves into its equilibrium phase.