


Adam Fletcher, Chairman of the IDEA commented: “IDEA believes that the European electronic components market will continue to grow in 2018 but probably at a slightly lower pace, with extended manufacturer lead times for all electronic components continuing into 2019.”
There are three primary metrics used by IDEA in the reporting process: Bookings (net new orders entered), Billings (sales revenue invoiced, less credits) and the ratio of the two known as the Book to Bill (or B2B) ratio. Fletcher added that while all three metrics are important, he believes that the Billings number is possibly the most critical value: “It’s the most accurate indicator of the performance of all organisations operating in the market. Companies are able to use the Billings figures to compare their individual performance with the market’s actual sales revenue performance.”
The data presented in the following graphics is shown in Euros and where necessary has been converted from local currency at a fixed exchange rate for the year.
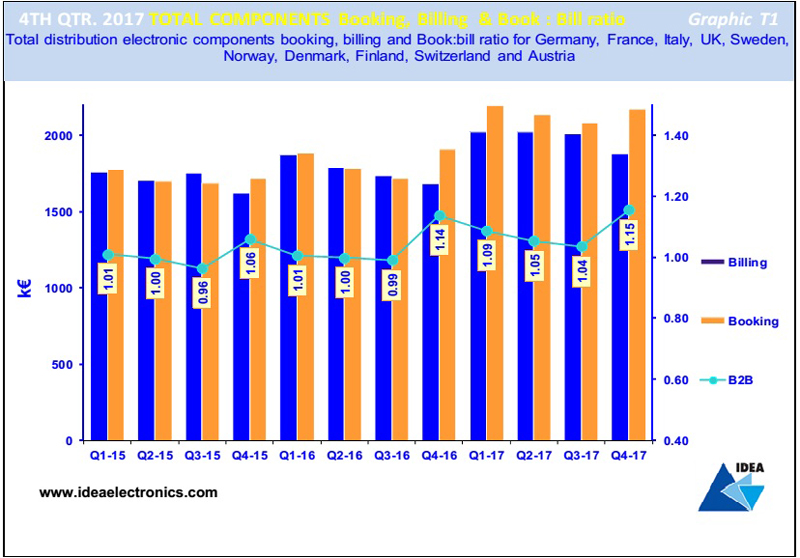
Graph T1 shows that Billings were fairly consistent in the first three quarters of 2017 but then declined by seven percent in Q4 2017, much in line with historical industry trends. Bookings also declined in the first three quarters of 2017, an unexpected outcome given current extended manufacturer lead-times, but then recovered to grow by four percent in Q4 2017.
The decline in the book-to-bill (B2B) ratio over the first three quarters of 2017 – from 1.09:1 down to 1.04:1 – indicated that Billings growth would slow into Q4, which in the event proved to be true. However, the 1.15:1 B2B ratio reported for Q4 2017 suggests optimism that Billings will probably increase as we move into Q1 2018.
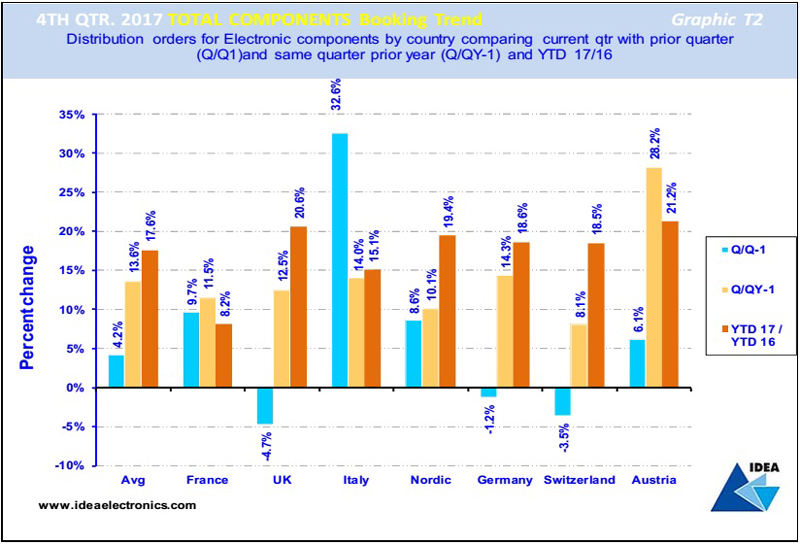
Graphic T2 compares the total electronic components Bookings achieved by each country in Europe in Q4 2017, and contrasts and compares the results with the previous quarter’s results and those achieved in the same period last year. The blue bar reveals that although Bookings in the UK, German and Swiss components markets declined in Q4 2017, Europe did however achieve an overall growth of 4.2%.
The light brown bar compares Q4 2017 with the same quarter last year and indicates that all European electronic components markets enjoyed strong Bookings growth, averaging out at 13.6% in the period. The dark brown bar compares Bookings achieved year to date (Y2D) with the same period in 2016, revealing an average Bookings growth rate of 17.6% in the 12 month period.
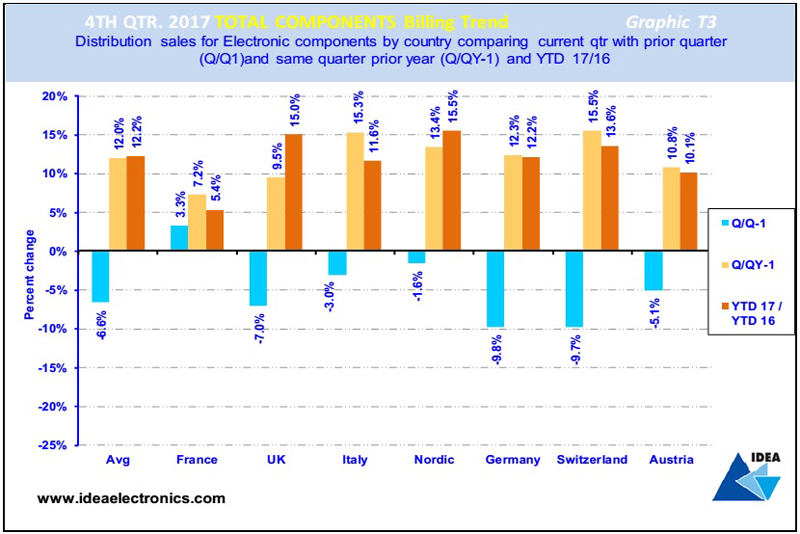
Graphic T3 illustrates total electronic components Billings achieved in Europe in Q4 2017. The blue bar compares this quarter with the previous one and reveals that – except for France – every country’s electronic components markets declined in the period, averaged out at (6.6%). The light brown bar compares Q4 2017 with the same quarter the previous year and shows that all European electronic components markets experienced strong Billings growth in the quarter, achieving average growth of 12%. The dark brown bar compares the current year to date Billings with the same period in 2016, revealing an average Billings growth rate over the 12-month period of 12.2%.