


In his quarterly Statistical Review of the European electronic components market Adam Fletcher, Chairman of the association uses three primary reporting metrics – ‘Bookings’ (net new orders entered), ‘Billings’ (sales revenue invoiced, less credits), and the ratio of the two known as the ‘Book to Bill’ (or B2B) ratio – to illustrate and explain the current European market situation to readers of Electronics Specifier.
According to Chairman Fletcher Authorised Distributors across Europe have provided outstanding customer support during the COVID-19 pandemic and are entitled to welcome a market up-tick now that the emergency is easing in Europe and global economic activity is increasing: “But I fear that the huge increase in ‘Bookings’ that IDEA members are currently seeing is something of an aberration. I’m certain they’ll see a significant retreat when manufacturer lead-times decline,” Fletcher said.
All three ‘B’ metrics are important in the reporting and monitoring process for organisations in the European electronic components supply network, but the consolidated ‘Billings’ number is possibly the most useful as it’s the most accurate indicator of average sales revenue performance achieved by European manufacturer authorised distributors: The data presented in the following graphics is shown in K€ Euros and where necessary, has been converted from local currencies at a fixed exchange rate for the year.
Overall Q1‘21 Bookings, Billings & B2B trends – European ‘Book to Bill’ increases exponentially in Q1 ’21
Graphic T1 is a visual representation of twelve quarters of consolidated European ‘Bookings’ and ‘Billings’, together with the corresponding ‘Book-to-Bill’ (B2B) ratios.
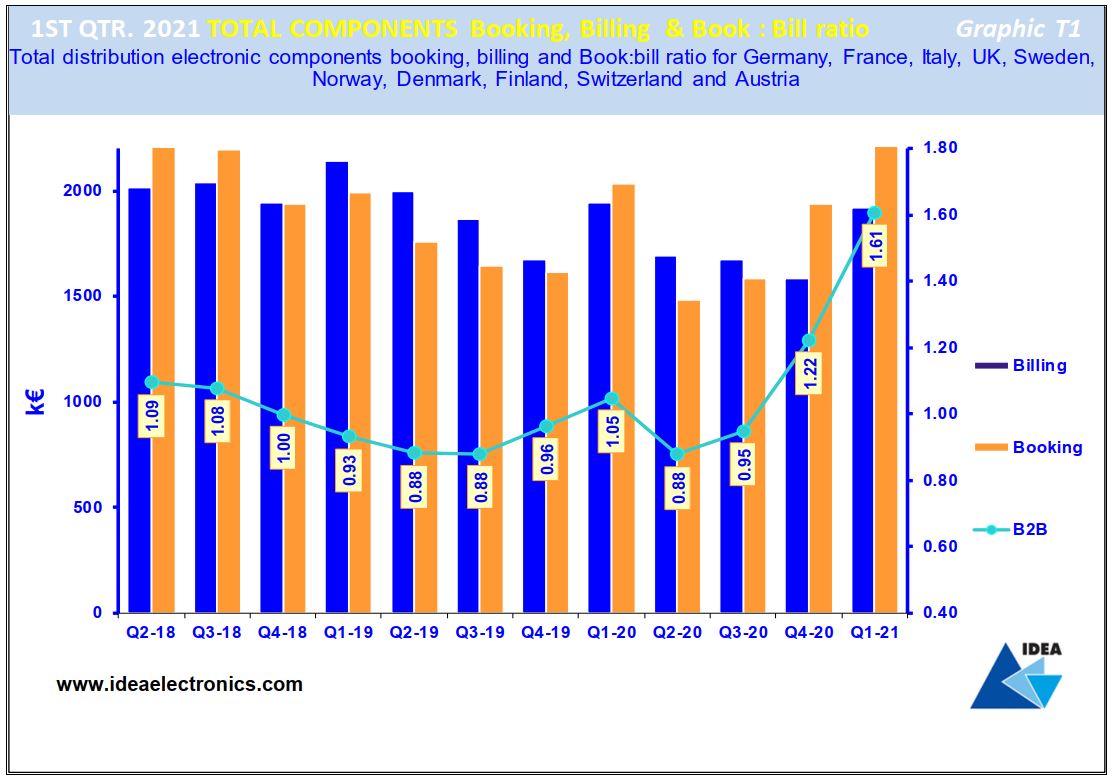
The chart reveals an exponential growth in ‘Bookings’ in the first quarter of 2021 amounting to a whopping 52% compared to the same quarter the previous year. In the same period ‘Billings’ also grew strongly (by 21%).
The Book-to-Bill (B2B) ratio leapt from 1.22:1 to 1.61:1 in Q1’21 and achieved one of the highest levels on record. A positive B2B figure – i.e. greater than one – is indicative of growth in electronic components markets, but a number below one is evidence of a decline.
Whilst these figures can be seen as very encouraging, its apparent that the market has been skewed in the period by customers urgently increasing their order cover on suppliers in responses to rapidly extending manufacturer lead-times.
Q1‘21 Bookings Trend – European Bookings increase exponentially in Q1 ’21
Graphic T2 compares the total electronic components ‘Bookings’ result achieved in each European country in Q1 ’21 and contrasts and compares these figures with the results achieved in the previous quarter and those achieved in the same period last year.
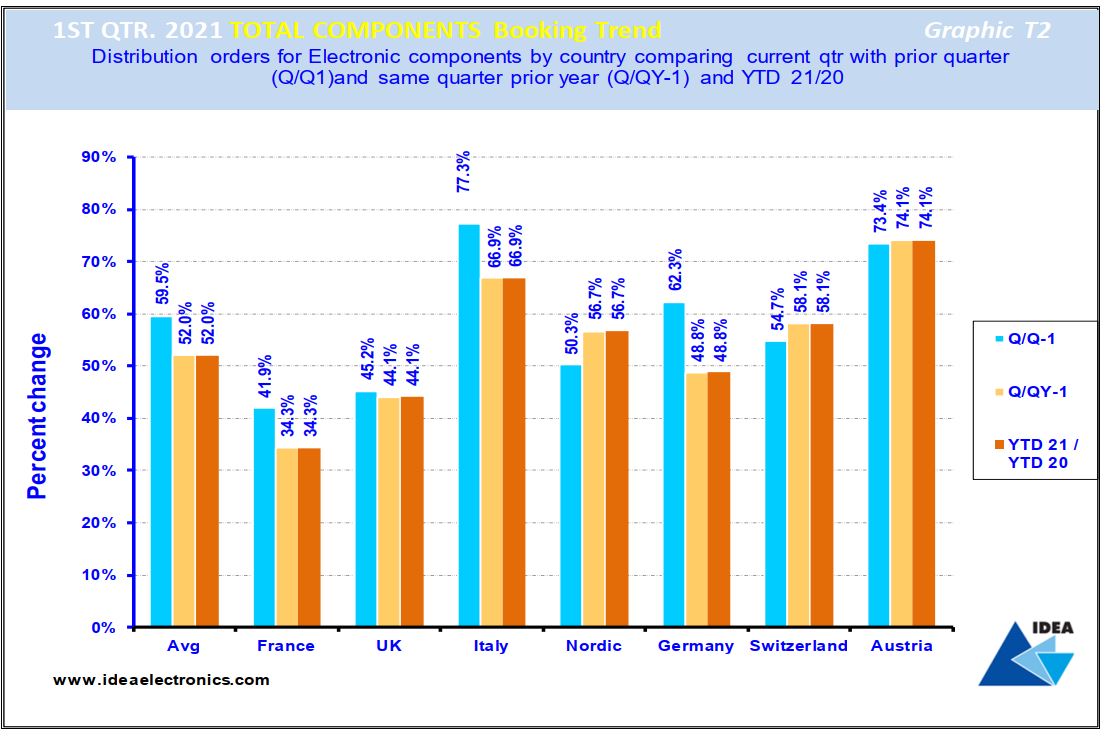
The blue bar reveals that on average European ‘Bookings’ increased by 59.5% in Q1‘21 when compared to the previous quarter. The light brown bars compare Q1’21 ‘Bookings’ figures achieved in each country with those achieved in the same quarter 2020 and indicate that on average, European ‘Bookings’ grew by 52% in the period.
The dark brown bar compares average ‘Bookings’ achieved in Europe year-to-date (YTD) with the same period in 2020, revealing that the average Bookings growth rate increased by 52% across Europe over the 12-month period. Of course, this performance reflects a real up-tick in customer demand across all European markets, but most of this demand should be seen as “phantom”, conjured-up by customer’ fears about exponentially extending manufacturer lead-times. As such, we’re almost certain to experience a reversal when supply and demand returns to balance.
Q1 ’21 Billings Trend – European Billings in Q1 ’21, reflect a more accurate picture of activity levels in the electronic components supply network
Graphic T3 illustrates total electronic components ‘Billings’ achieved in European markets in Q1 ‘21 and contrasts and compares the figures with the previous quarter’s results and those achieved by IDEA members in the same period last year.
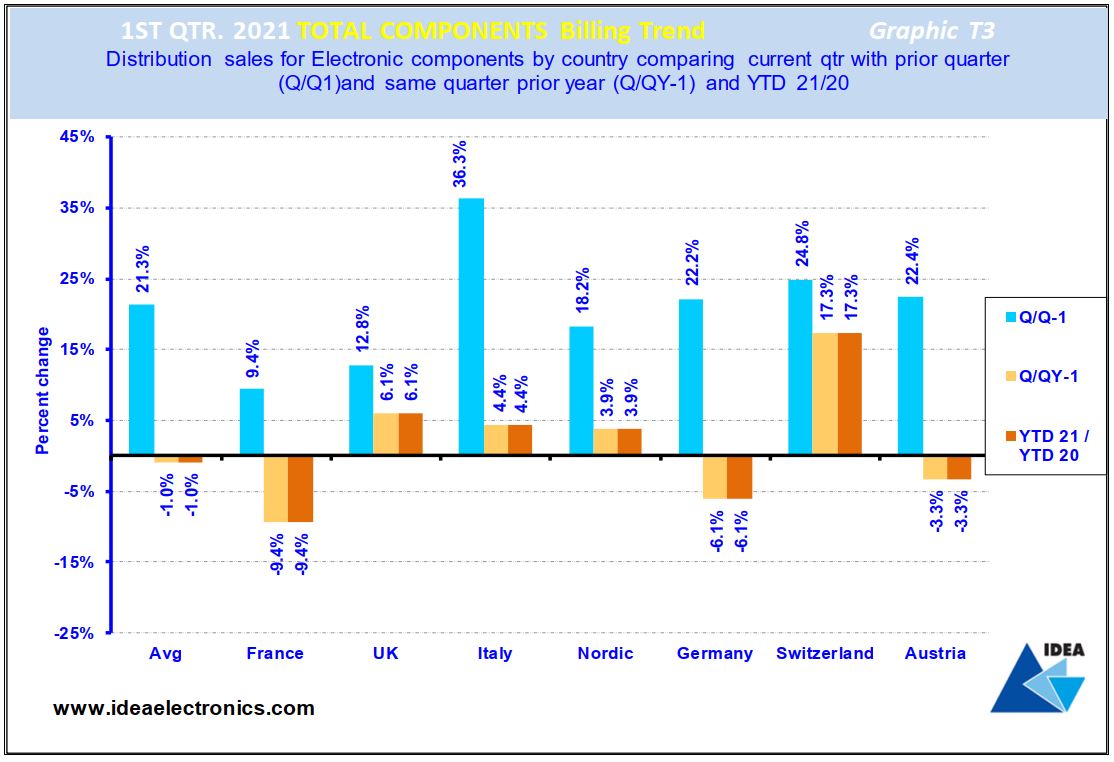
The blue bars reveal that European electronic components markets experienced an average growth of 21% in Q1 ‘21 compared to the previous quarter. The light brown bars compare Q1‘21 with the same quarter 2020, revealing that in fact, the European electronic components supply network suffered a (1%) decline in the quarter.
The dark brown bars compare current YTD ‘Billings’ with the same period 2020. This figure confirms the average decline of (1%) across the European electronic components supply network YTD despite the unprecedented increase in ‘Billings’ seen in Q1.
Even given the positivity engendered as European economies emerge from the global pandemic this is a disappointing result but should perhaps be seen as accurately reflecting the performances of European manufacturer authorised distributors, all of whom have become adept at trading in adverse conditions. IDEA members remain confident that the low point in the current economic cycle has been passed and they are optimistic that modest ‘real’ growth will return to the European electronic components supply network during the current year.