


There are, of course, many factors to consider, and multiple standards such as Zigbee and Bluetooth Low Energy (BLE) – but for portable, battery-powered products, power consumption is one of the most important criteria. A designer wants the power requirements to be as low as possible, so that battery life can be maximised, but this must be balanced against the performance and capabilities required.
In practice, it can be difficult to work out which wireless IC is going to give the best results in a real-world application, and to compare different chips from multiple vendors. The natural starting point is to look at the datasheets for the key parameters, but they don’t tell the whole story.
Let’s look at the impact of different factors in practice, and how benchmark testing can be the best option for engineers to find the right device for their application.
What the datasheet doesn’t tell you
Specifications that look identical across datasheets may be measured differently. Some specifications may be omitted, or difficult to find.
Also, datasheets don’t always give an accurate idea of how a device will behave in a real application. For overall power consumption, we need to consider factors such as how long a device takes to wake from sleep, as well as the device’s efficiency, which may be difficult to evaluate based on the datasheet.
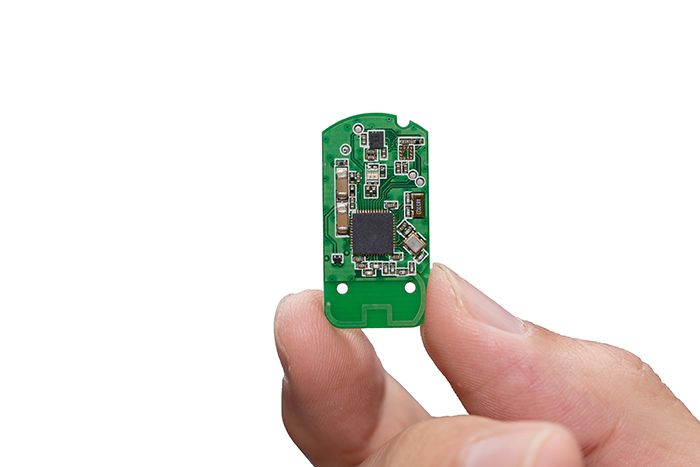
Above: If you’re a design engineer working on an IoT product, how do you choose the best wireless IC for your new device?
For example, μA per meter is a good indicator of power consumption for RF activity, but developers must look at both range and μA per meter to see if a device is a good fit for their application. In Figure 1, Vendor B has one of the lower μA-per-meter values, but if you look at the range, it is the lowest of all four vendors. From this comparison, Vendor C has the best range and the lowest μA-per-meter values.
Software protocol stacks can also greatly affect battery life. The timing and efficiency of the protocol stacks directly affects battery life. Specific protocol features also have an impact on battery life. A network that is often awake and sending messages may result in receive and transmit current consumption being a greater part of overall battery discharge, for example, whereas another network may leave devices asleep for more time. And, of course, protocols with smaller payloads will result in more packets to send data, which generates more network traffic and increases RF transmissions. Each of these factors can have a direct impact on robustness and battery life.
Interpreting datasheets
Figure 2 shows four 802.15.4/BLE devices from different vendors. This chart shows how similar specifications may be represented differently in product datasheets and how this could impact battery life. For example, the memory size quoted may not reflect what is available to user code, as protocol stacks may take up different amounts of Flash and RAM – for example, BLE is typically smaller than Zigbee.
To look at one example parameter, in Figure 2, Vendor C has a dedicated security core which can perform an essential ‘elliptical curve’ operation in just 5ms, while another device takes 80ms for the same task. More time spent awake and running operations means more current used, but this kind of information is typically not available in the datasheet. Even where data is provided, such as the maximum transmit power, not everything is clear – for instance, different devices may draw different currents at different voltages to achieve this power figure.
One of the biggest issues can be sleep current, as there is so much variability amongst vendors about how this is derived – how much RAM is retained? Is the cache enabled? And so on. Other key datasheet specifications that may not represent real-world applications include active current, radio current, link budget and supply voltage. Different vendors may use different means of measuring these specs or may list them differently in their datasheets, but these variations can have a significant impact on device performance and battery life.
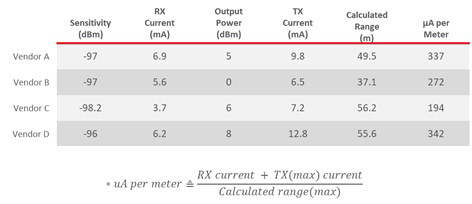
Above: Figure 1. μA per Meter
Measuring power usage with benchmarking: With the limitations of what can be calculated from datasheets, benchmarking is really the only way to accurately measure power consumption and battery life in the real world. By benchmarking, we can look at a device’s behaviour in realistic operating conditions, and for common tasks, in much more detail than a datasheet allows.
For a good example, see Figure 3, which shows two BLE devices that wake up, receive a packet, transition to a transmit, process the data and then go back to sleep.
Figure 3 shows the current used and the time required for the devices from Vendor C and Vendor E. Based solely on a datasheet comparison between the two and the figures quoted, it looks like Vendor E would consume about 30% less current consumption. But, based on benchmarking, Vendor C in fact can be seen to have about 50% lower current consumption for the entire transaction.
Why is this the case?
Wake up time: Vendor E takes much longer to wake up and stabilise before transmitting, which uses more current. This could be due to the IC wake up time and/or the efficiency of the BLE stack.
Transmit (TX) and receive (RX) current: Vendor E’s power consumption for TX and RX are much higher than indicated in the datasheet. The datasheet values for vendor E were around 6mA for TX and RX, while measurements showed them to be around 10mA for TX and 9mA for RX. Vendor C was also higher than the datasheet, but only by about 1mA.
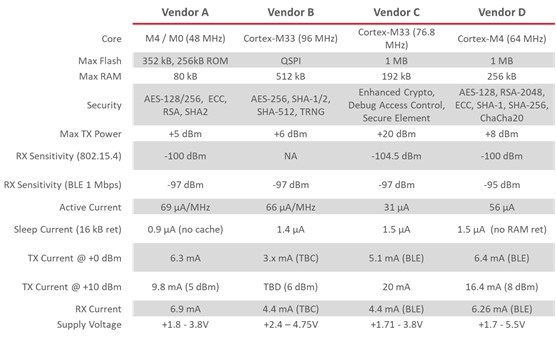
Above: Figure 2. Datasheet Key Spec Comparison
Processing and sleep transition time: Vendor E has a very long processing time before the device goes to sleep after its work is done – using more current. Again, this might be due to the IC, stack efficiency or a combination of the two.
Conclusion
Comparing datasheets alone does not provide an accurate picture of the differences between competing wireless IC devices. Developers must consider other factors beyond the information provided in the datasheet that affect current consumption and real-world performance.
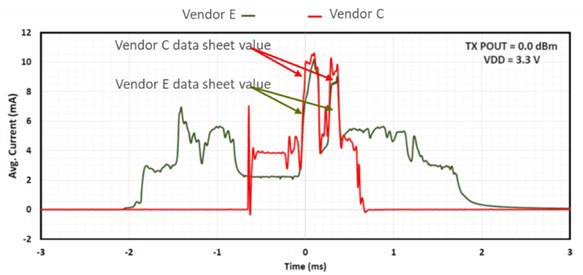
Above: Figure 3. Benchmarking comparison
Although datasheets are a good starting point, they are not always representative of real-world performance. Other factors must also be considered that may not be adequately detailed in a datasheet, such as wake up times, radio transition times, peripheral activity, and transmit and receive times. Software stacks can also have an impact on battery life, and efficiency can vary between vendors.
For these reasons, a more comprehensive approach is needed to fully understand the differences between competing devices. This should include a review of key datasheet specifications and non-datasheet items, as well as benchmark testing to accurately measure power consumption and battery life.