


Ask most embedded systems students to explain task scheduling or semaphore behaviour and they can do it. Ask them to show you what is actually happening inside their running system and they go quiet. The gap between theory and observable behaviour has long been one of the hardest problems in teaching real-time systems.
Florent Goutailler, Associate Professor at Télécom Saint-Etienne, describes how adding a runtime visualisation tool to his FreeRTOS course closed that gap – and transformed the way his students approach engineering problems.
From guesswork to direct observation
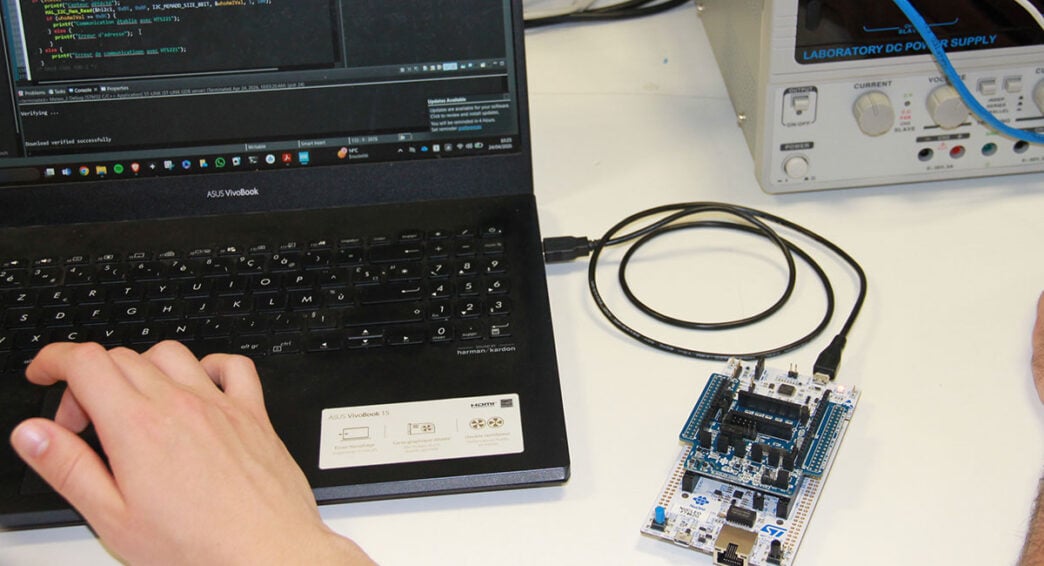
I teach a 25-hour Real-Time Embedded Systems module to final-year Master’s students in Electrical Engineering, based on FreeRTOS and STM32 platforms. The course covers scheduling, synchronisation, communication mechanisms, and software timers.
For many years, I observed the same pattern: students could write code that compiled and ran, but when something didn’t behave as expected, they struggled to understand why. Debugging relied on breakpoints or printf statements – inefficient approaches that can also interfere with the timing behaviour of the system itself. In a real-time context, that is a serious limitation. Students were learning the concepts, but not always truly understanding them.
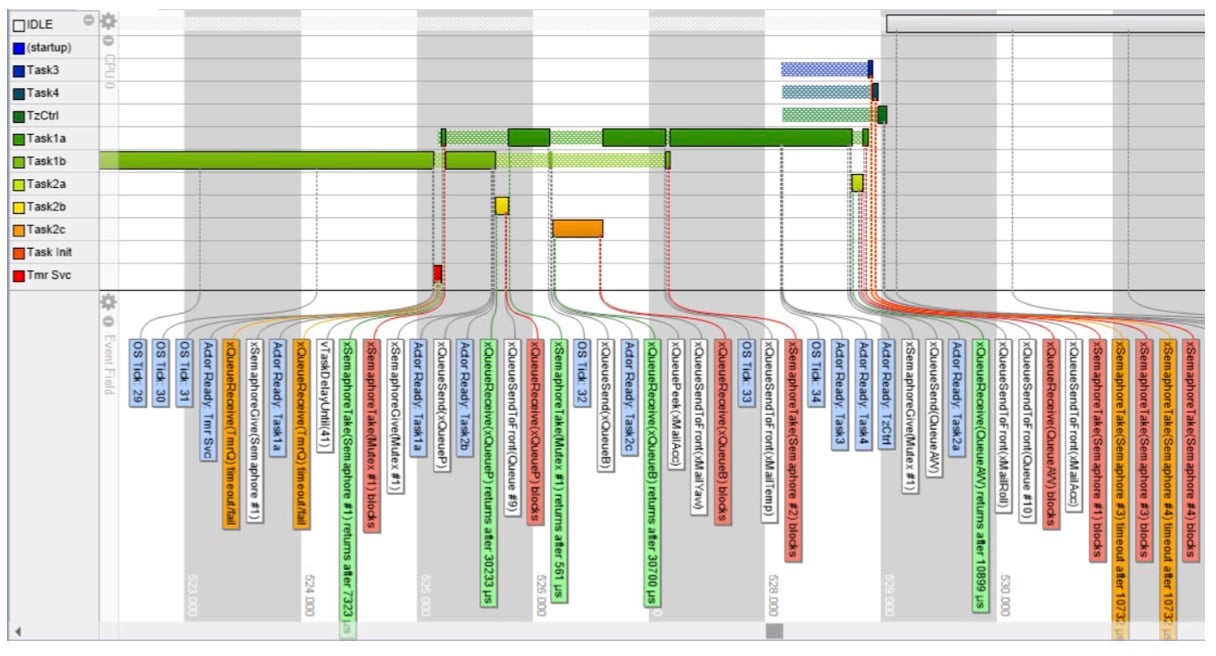
That is what led me to introduce Percepio Tracealyzer into my course. Runtime events are recorded into a trace buffer on the target and visualised as a detailed sequence of system activity. Instead of guessing how scheduling decisions unfold, students can see them on a timeline. They can see when a task is running, when it is blocked, and what caused the blocking. They can observe how semaphores and queues evolve during execution, and how task priorities influence interactions. They also gain access to system-level insights that are difficult to obtain with standard tools, such as heap usage and per-task stack consumption.
This shift – from assumption to direct observation – fundamentally changes how students’ reason about system behaviour.
From debugging tool to learning tool
Initially, I introduced Tracealyzer as a way to improve debugging. It certainly achieves that. However, it quickly became clear that it was also an important teaching tool in its own right.
Students begin to use visualisation not just to fix problems, but to validate their understanding. They move away from trial-and-error debugging and instead analyse system behaviour directly. Issues that previously took hours to isolate – such as unexpected blocking or misinterpreted scheduling behaviour – can often be understood within minutes by examining the trace. Students also begin to explore independently, using timeline views to identify blocking points, analyse task interactions, and investigate performance issues on their own.
A more professional approach to projects
The benefits become even clearer during the project phase.
Students are required to design a complete real-time application, typically involving data acquisition tasks synchronised with software timers, data processing tasks, and communication through message queues. I encourage them to use Tracealyzer from the earliest stages of their design, not just at the end.
They begin by validating core mechanisms such as task synchronisation and inter-task communication. As their system grows, they use trace data to debug and refine it. By the end of the project, they are able to verify temporal determinism by analysing execution timing, task response latencies, and scheduling behaviour under realistic conditions – and they must demonstrate this in their final submission using annotated trace data.
This fundamentally changes the nature of the exercise. Students are no longer simply delivering a working system; they are providing evidence that it behaves correctly under real-time constraints.
Changing habits early
Another notable outcome has been how quickly students adopt new working habits.
With the help of a template project and two introductory videos, they are able to start using Tracealyzer without difficulty. Very quickly, it becomes part of their development workflow. The use of printf debugging fades away, replaced by a more systematic and reliable approach based on trace analysis.
Students also begin to explore independently, using timeline views to identify blocking points, analyse task interactions, and investigate performance issues on their own.
Bridging the gap to industry and beyond
One of my goals in teaching this course is to prepare students for real-world engineering challenges, and Tracealyzer plays an important role here by introducing students to a workflow that reflects professional practice – observing system behaviour, analysing performance, and validating timing requirements using concrete data. The only limitation I have encountered is Tracealyzer’s current lack of native macOS support, which can be a constraint in some teaching environments. Aside from this, I would strongly recommend integrating visualisation tools like this into any real-time systems curriculum.
When students can see how their systems behave, they move beyond theory and develop the habits of practicing engineers: questioning assumptions, validating behaviour, and making decisions based on evidence. In real-time systems, where timing and interaction define correctness, that shift is not beneficial – it is essential.