
VNA test technology achieves improved antenna performance
The basic principles of, and methods for, measuring antenna performance were established decades ago. So it might appear reasonable for engineers developing or installing RF equipment to assume there is nothing new for them to learn in this field.
By Jean-Pierre Guillemet
Field Applications Engineer, Anritsu (France)
In fact, however, the recent introduction of new, improved test instruments has markedly changed the impact that the testing regime can have on system performance. Better antenna testing can help engineers to achieve higher sensitivity and a wider frequency range, as well as accelerating the test process itself.
This article describes the way that improved antenna testing may be achieved through the use of a new generation of vector network analysers (VNAs). It also shows several parameters, such as the distance between antennas and the dynamic & frequency of measurements, have a marked effect on the best way to configure the test environment with these instruments.
Important parameters in antenna measurement
Antenna measurement can be used either to support the engineer’s choice of antenna, or to evaluate the characteristics of the environment in which the antenna is to be used. An antenna is characterised by values for a small set of parameters, of which the most commonly measured are:
- Frequency
- Gain
- Impedance
- VSWR (Voltage Standing Wave Ratio)
- Radiation pattern
- Polarisation
- Phase
- Isolation
These values may be presented simply in a table (see Figure 1) and radiation pattern diagrams (see Figure 2). But today’s powerful software tools can also provide useful visual representations such as 3D colour maps (see Figure 3).
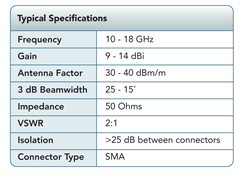
Fig 1
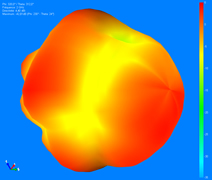
Fig 2
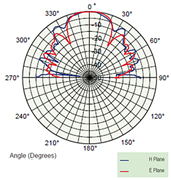
Fig 3.
The basic principle of antenna testing requires the generation of a signal by a source, transmitted through a source antenna (see Figure 4). The signal received by the antenna under test (AUT) is then compared to the original signal by an analyser connected to the AUT.
.jpg)
Fig 4
How configuration of the measurement system affects test outputs
Antenna measurement has been transformed in recent years by the introduction of a new generation of VNAs. Offering wider frequency coverage and dynamic range than any previous equipment, these instruments give for more accurate results of antenna performance, even at the multi-GHz frequencies in use in communications, imaging and other applications today.
An instrument such as the MS4640B VectorStar from Anritsu will operate at frequencies from 40kHz to 70GHz in the mainframe unit (see Figure 5). This range can be extended to 1THz with the addition of discrete modules. It contains internal synthesizers that serve as a source and local oscillator.
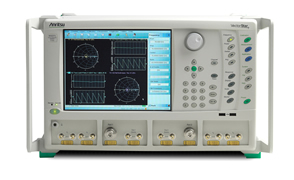
Fig 5
This new generation of test equipment provides a clearer picture of the variations in antenna performance caused by variations in its use. Choosing the test configuration that best matches the application in which the antenna is to be used is more important than ever before.
This will now be illustrated by reference to a number of different test configurations. In this analysis, the following terms are used:
The dynamic range of the test equipment is the difference in dB between the power applied to the antenna source and the sensitivity of the analyser.
The dynamic range of the measurement system adds the antenna’s gain and space loss to the dynamic range of the test equipment. This value determines the maximum range within which the antenna can be measured.
Frequency range: the antennas are tested at several point frequencies in order to cover a frequency range. Reducing the number of frequencies to be measured shortens the measurement time.
Phase measurement isused to measure the phase centre of an antenna or network. This also enables the engineer to position the AUT in its test environment at its phase centre.
Measurement time encompasses two values:
- The measurement timeper point is a factor of the instrument’s operation – for instance, the speed at which it changes frequency and saves data. The MS4640A from Anritsu is the quickest on the market at 20µs per point (this includes synthesised sweep, Display ON and ALC ON).
- The time to position the antenna is additional to the instrument’s measurement time.
The simplest VNA configuration, shown in Figure 6, is suitable when the distance between the source antenna and the AUT is short – around 10m – and for frequencies below 40GHz. Here, power losses in the components of the system are low – commercial cables typically lose 1dB/m at 20GHz and 2.5dB/m at 40GHz. Additional losses due to the connectors and the rotary joint are typically <3dB.
.jpg)
Fig 6
To determine the measurement system’s range, a complete power balance calculus has to be performed. Let us take as an example an antenna test system working at up to 20GHz. The AUT and source operate at 12-18GHz with a minimum 18dB gain, at a distance of 10m between the antennas. The calculus adds space loss of ~79dB at 20GHz, 36dB antenna gain (18 +18), and 13dB (3dB + 10 x 1dB) of loss in the cables and connectors. For a desired test system dynamic range of 40dB, then the dynamic range required of the VNA is 79-36+13+40 = 96dB.
The dynamic range required of the VNA is the ratio Pout / Pin. Pout is the power delivered by the source of the VNA. Part of the source is routed internally to REC-1 to serve as a reference signal. The VNA must have sufficient sensitivity to measure low levels of Pin (the signal received by AUT and routed to the VNA at REC-2). Using the previous example, for a 96dB dynamic range, and Pout of +10dBm then the VNA must have sensitivity of -86dBm to perform the measurement successfully.
Note that the required sensitivity depends on the desired accuracy. For a VNA, the sensitivity specification is related to its internal level of noise. This noise is added to the measured signal, which brings an element of uncertainty into the measurement.
The first test system configuration set a distance of 10mbetween the antennas. Amplification of the power source would provide a higher dynamic range and a greater distance between the antennas.But there is a limit to the amount that the source power can be amplified, especially because of the loss of the components as the system configuration loses its effectiveness.
Figure 7 shows a configurationthat addresses this problem. Here, the VNA mainframe no longer provides the source, which is now placed close to the transmitting antenna, meaning that the cable is shorter and therefore lesspower is lost. But to maintain a reference signal, a coupler is used to route a portion of the source signal to REC-1.
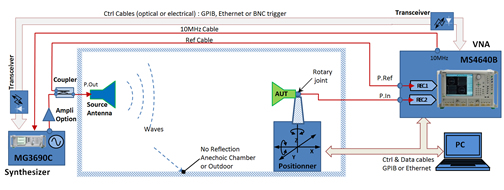
Fig 7
There are now two channels to calculate in order to determine whether the measurement configuration is correct: at the measurement channel(from source to REC-2) and the reference channel(from source to REC-1). We have already discussed the measuring channel above.
In the reference channel, power losses are attributable tothe coupler plus the reference cable and connectors.Let us take as an example an outdoor antenna measurement system with100m distance between antennas and operating at up to 18GHz. Let us assume losses at the coupler of 20dB,a low-loss cable rated at 0.67dB/m at 18GHz and connector losses of 3dB. In using a power source of +30dBm, -60dBm is input at REC-1, which is sufficient to serve as a reference signal.
Characterisation of an antenna is made over a frequency range. In the previous example, the VNA controlled the frequency both of the internal source and analyser (which are identical). In Figure 7, the source must be controlled remotely. This can be done with a PC, but this requires careful checking and control if frequency changes are to be verified. It is therefore best to leave the VNA to control the synthesizer, since it has an application dedicated to this. The 10MHz signal linking the VNA to the synthesizer allows for the source and analyser frequencies to be synchronised.
The situation is different again for applications involving frequencies higher than 40GHz or very long distance of test configuration. Here, losses in the cables and connections have a very large effect. The way to minimise these losses is by frequency translation. Where the system must measure amplitude and phase, the signals at the two receivers must have the same frequency.
Two configurations are possible. The first uses modules that can act as either source or receiver (see Figure 8). These modules perform a frequency conversion, raising the frequency ranges by up to several hundred gigahertz. Anritsu manufactures small modules that can be mounted easily even in compact test environments.
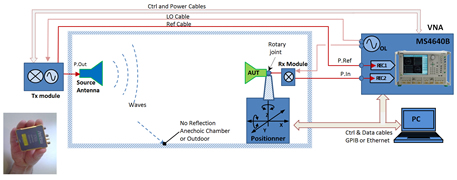
Fig 8
An alternative arrangement uses an external source and two mixers (see Figure 9). It should also be noted that a test configuration can also be made with optical components, but this approach falls outside the scope of this article.
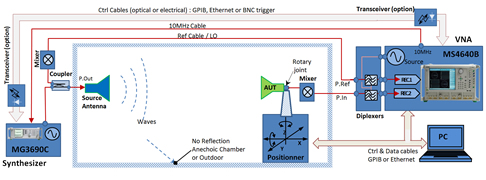
Fig 9
In all the configurations described above, a reference signal is created by splitting the source signal and routing a portion of it to the analyser. But this reference signal has not passed through the entire source channel (cable, antenna source...), so any change in the gain between the coupler and the AUT will contribute error to the measurement. Figure 10 shows a configuration that addresses this source of error: here, the AUT and the reference antenna measure the transmitted source signal simultaneously.
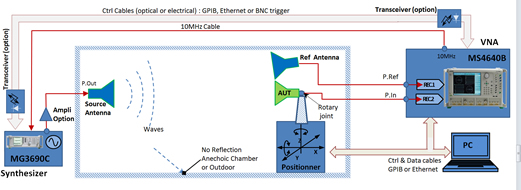
Fig 10
There are two advantages to this configuration: the reference signal gives the most accurate possible picture of the measured signal; and the losses in the cable carrying the signal from the source are eliminated. The drawback is that the reference antenna is now in the measurement space of the AUT, which can significantly disrupt the measurement. It should be noted in particular that the positioner moves the AUT, and so interactions between the AUT and the reference antenna are possible.
Conclusion
A VNA is a valuable instrument to engineers characterising an antenna. It provides sources and receivers to generate and measure signals, and it offers features such as calibration and domain time that can be used to improve the measurement.
As described above, the latest generation of VNAs offer improved specifications in a number of important parameters, including frequency range and dynamic range. By using the appropriate test configuration, the performance of a fast, accurate instrument can be put to best use.
Product Spotlight
APV1111GVY
Panasonic

Panasonic PhotoMOS® Photovoltaic MOSFET High-Power Drivers
| SKU: | |
|---|---|
| Stock: | 3490 |
| Cost: | $3.95 |
