
Testing & debugging on the run
Simplified runtime analysis and error checking for embedded software. By Anders Holmberg, IAR Systems.
It is a known fact that software contains errors and that developers often spend ‘too much’ time testing and, especially, debugging software; trying to track down the really tricky issues. Anything that can help reduce test and debugging time will help deliver more robust software faster, which is techniques such as runtime analysis and dynamic runtime error checking were developed; to address this bottleneck when developing embedded applications.
Runtime analysis and static analysis are often depicted as mutually exclusive, but in fact these two techniques complement each other: static analysis can highlight potential errors along all execution paths, even paths that will never be executed, at the price of a high rate of falsely indicated errors; runtime analysis will pinpoint errors along realistic execution paths, so precision is much higher, but dependent on test coverage. This article looks at runtime analysis and its technical implications in the development flow.
A touch of class
When speaking about software errors and defects, it helps to have a classification of what kind of errors developers are dealing with. The Common Weakness Enumeration hosted by SANS Institute and MITRE is a collection of known and classified software vulnerabilities. The database collects weaknesses from all over the software field, and most interesting to us is the complementary list of the 25 software errors classified as most dangerous and the accompanying list of 15 runner ups compiled in 2011 (Table 1).
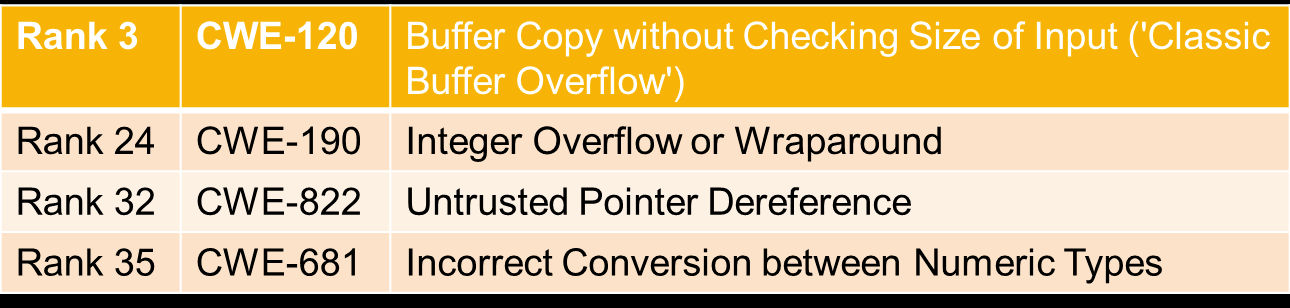
Table 1 - Software vulnerabilities from the Common Weakness Enumeration database
The ‘interesting’ thing with the C language is that the problems in Table 1 (and then some) are more or less built into the language. For example, it is perfectly legal to wrap-around an unsigned integer variable and often it is the most efficient and convenient way to accomplish something, but sometimes this property of the language will strike back. Further, although it is not legal to overflow a signed integer variable, a compiler will often emit fairly sensible code for an overflow anyway, at least as long as optimisation is turned low.
Developers might rely on the fact that, for example, assigning a larger signed type to a smaller signed type is OK as long as there is no overflow or truncation. The larger type might be part of a reusable API and the API guarantees that the values will never overflow our smaller type, but subtle API revisions might break this. The tricky thing is that a garbled value can be legal input in the client code, so an error can go unnoticed through testing since the code seems to behave correctly.
Pointers are another source of great joy and once again the language in itself does what it can to keep out of the way and allow developers to shoot off feet and other extremities. The fact that a pointer can be coerced to point to essentially anything, accepts more or less unbounded arithmetic and that basically the only form of access control is if the hardware generates an exception, does not really help in creating correct programmes.
Chasing stray pointers can take literally forever, as a write through a bad pointer might affect data not even remotely associated with the offending write. And reading data from a bad location might not trigger an error in testing either, if the data can be interpreted as valid. Similar situations can arise when dealing with dynamically allocated memory if the code accidentally writes to a block that is already de-allocated. Another part of the program might have allocated the same block or a part of it and written new data to it.
Pointer issues are especially insidious, since a single out-of-bounds write can open up the code for external attacks. If the program can be tricked into doing a buffer copy that overruns a fixed-size buffer on the stack, this can be used to copy in a piece of malicious code on the stack and replace the correct return address with an address into this code. As seen in Table 1, such attacks are a classic way to break a system and CWE-120 is actually the highest ranked CWE weakness that is not an SQL injection or OS command injection vulnerability.
On common ground
As noted above, the trickier errors of these types are very good at surviving through the testing phase. This is not really strange, since bad behaviour is often triggered by unexpected behaviour at the external interfaces of the program combined with the fact that an erroneous situation might arise without visibly breaking the system. In many projects, testing is naturally driven by the functional specification, so emphasis is directed to the described use cases and associated scenarios. Further, creating negative tests that can provoke visible errors in the running system is often laborious and time-consuming. It is an art to design tests that have no other purpose than compromising the system instead of just confirming behaviour for expected input.
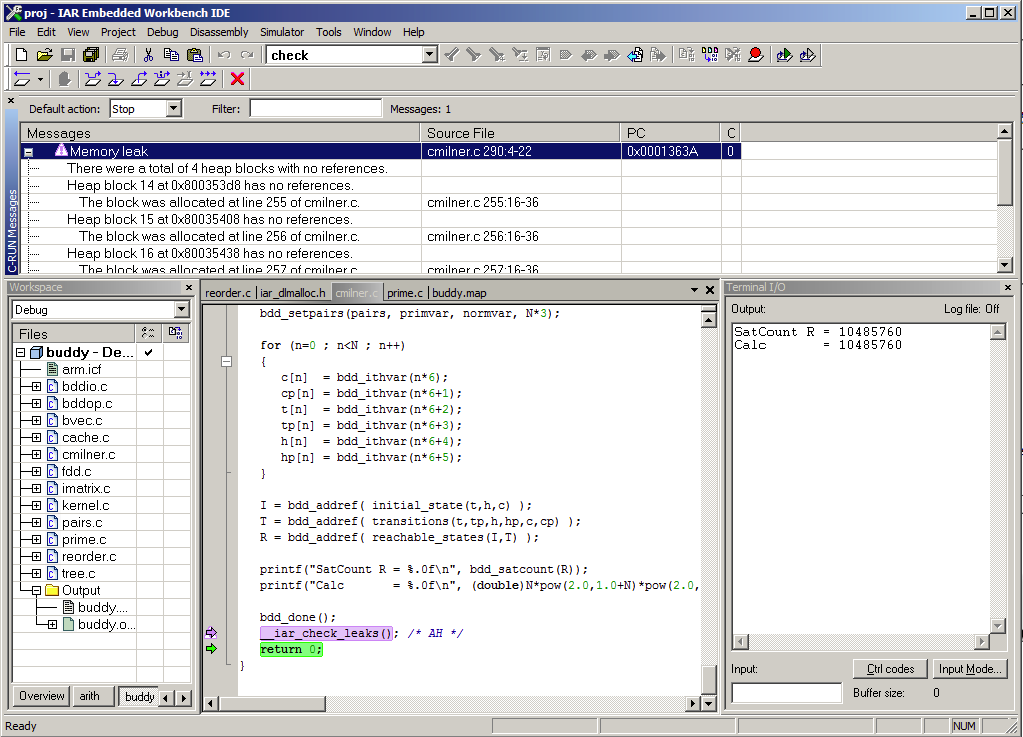
Figure 1 - Memory leak
Arithmetic issues include overflow, wraparound, conversion errors, division by zero and missing default labels in switch statements. Such errors can be detected by inserting instrumentation code in places where an error can happen. Source level instrumentation essentially inserts an if-statement that checks the condition and prints something to stdout or writes a magic value to a port for logging. Analogously, a compiler can insert code that checks the condition and reports issues at runtime. Checks like these are easy to perform and do not in general influence RAM requirements or stack depth. For example, compiler-directed checking for division-by-zero amounts to no more than checking the divisor against 0 before performing the division, so the full check is essentially one instruction for the comparison and one or two instructions for jumping to some reporting code.
Bounds checking include writing or reading outside the bounds of an array. But the concept can be generalised to deal with anything that is accessed through a pointer regardless of type or size. So if the code, or someone with malicious intent, happens to change a pointer to something on the stack, a state-of-the-art bounds checker can detect if the new pointer value is legitimate. Tracking pointers is not easy. It can be done on the source level, but really gains from being done by a compiler. A reliable and fast bounds check needs to keep track of pointers and associated ranges, as well as use this information at each access through anything that looks like a pointer. Bounds checking will impact not only performance, but also code size and RAM requirements; the trick is to make it as small as possible.
An additional complexity with bounds checking is how to deal with pointers that pass through interfaces to or from libraries only available in object form or assembly language. Such situations must invariably be addressed by the user, but differences in complexity and ease of use can be significant depending on the tool being used.
Heap checking verifies that the heap retains its integrity and does not leak allocated blocks over time. Efficient heap checking is basically an exercise in library implementation, but owning the associated compiler can be beneficial if some functionality can be treated much the same way as other compiler intrinsic functions. Integrity checking is typically done on each call to malloc, free and their friends, both in the C and C++ world. Checking can also mark certain memory blocks to not be part of leak detection or check leaks or heap integrity at arbitrary execution points.
Back to basics
For runtime analysis and error checking, IAR Systems has introduced C-RUN, an add-on to the C/C++ compiler and debugger tool chain IAR Embedded Workbench. C-RUN covers arithmetic checking, bounds checking and heap checking. The typical use case of this new tool involves setting the desired options, rebuilding the project and running it in the debugger to identify any issues.
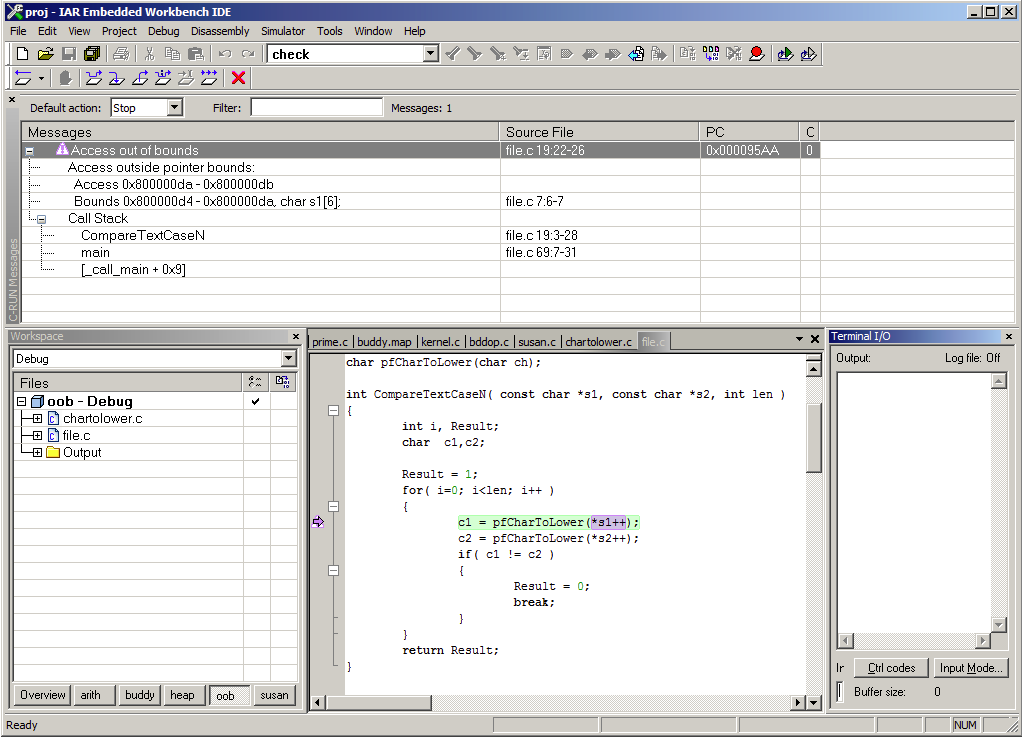
Figure 2 - Bounds checking
The debugger will show in great detail exactly what went wrong and show the call stack. The workflow is easy, without integration issues, incompatible tool versions, learning a new parser how to ignore target specific keywords or finding include files and symbols. The default reporting mechanism of C-RUN is optimised for use in the debugger in IAR Embedded Workbench. However, it is not always possible to run full-scale integration tests with a debugger attached, due to for example electrical insulation and separation. For such cases, the default reporting can easily be replaced with another appropriate way of reporting, such as logging to memory or file or writing to a dedicated port.
By not being in the way or requiring some magic hand waving to get going, C-RUN is designed to be integrated in the day-to-day development workflow, no matter if working in a traditional edit/build/debug cycle, running unit tests or doing integration tests.
Choosing the right instrument
But in what way is compiler-directed instrumentation different from source level instrumentation? On the surface it is more or less the same thing; the tool must insert instrumentation code at all interesting places, i.e. where something worth checking takes place. In practice there are some differences. First, the compiler knows the difference between application code and code needed for the runtime checks. This means that the compiler can first employ a battery of optimisations and then insert optimised instrumentation code on what’s left. Second, when instrumenting on the source level, the instrumentation code is likely to inhibit quite a lot of optimisations that would have been possible on the original code. This is essentially due to the same thing as above: the compiler has no idea that large parts of the code it looks at are special and can thus receive special treatment.
In the end the amount of code that can fit on target or the needed real time performance can determine what kinds of tests can be run on the production hardware and how many permutations of instrumented test builds have to be created and run. Worst case, with too much overhead from the instrumentation one might not be able to run any checked tests on hardware. That being said, it might be so that a compiler optimises the code in such ways that a potentially erroneous operation will not happen. And this might happen regardless of how the instrumentation was done. So given time and space it can be beneficial to also test with optimisation levels that are lower than the ones used for production builds.
Integration
Integration with the developer’s build environment can be a headache, since the instrumentation tool essentially needs to have the same information about the code and build environment as the build tool chain. The tool also needs to support the same languages as the build tool. This sounds like a no-brainer, but given things like language extensions and different interpretations of the language standards it is definitely not a given thing. Add complicated build dependencies, header file opacity and complex include hierarchies and it can be a mess to set up something that at the same time works for daily development. Some tools want to own the whole build and test process, effectively introducing yet another IDE in the developer’s toolbox. Integration into the build tool chain enables very easy setup of one or more build configurations that include parts or all of the C-RUN checks and switch between these configurations and the original build configuration.
There are several state-of-the-art test and analysis tools on the market operating on the source level, which cannot be replaced by C-RUN. However, these tools are mainly used in dedicated unit test, requirement validation and compliance scenarios. In contrast, C-RUN focuses on the low-level, close-to-the-metal stuff and through an easy-to-use interface provides developers with extremely valuable feedback already as soon as the first iteration of code is about to be taken for a test drive. And thanks to its tight integration into IAR Embedded Workbench, C-RUN can be part of the daily work for any developer - making it easy to run.
Product Spotlight
APV1111GVY
Panasonic

Panasonic PhotoMOS® Photovoltaic MOSFET High-Power Drivers
| SKU: | |
|---|---|
| Stock: | 3490 |
| Cost: | $3.95 |
