
Mixed signal testing using modular PC instruments
Testing mixed signal devices requires both analogue and digital measurements. Analogue measurements, which acquire data samples with high amplitude resolution as a function of time, are used to test physical layer compliance with test standards, and digital measurements, which obtain data samples with single bit resolution versus time, assure data state as a function of time and permit evaluation of protocol content. Oliver Rovini - Technical Director, Spectrum Instrumentation and Arthur Pini – Independent Consultant explains more.
The electronics world is becoming increasingly digital in nature. In addition to obvious mixed signal circuits such as Analogue to Digital Converters (ADC’s) and Digital to Analogue Converters (DAC’s) there are also Field Programmable Gate Arrays, (FPGA’s) and Phase Locked Loops (PLL’s) which are part of the growing array of mixed signal devices.
These devices typically operate at higher frequencies and require measurement instruments with greater bandwidth while simultaneously employing digital controls.
A mixed signal digitiser offers users several advantages when testing todays electronic components and systems as they allow users to view each of these signals in either the analogue or digital domains simultaneously.
Displays of either domain are time synchronous which helps in finding problems. Diagnosis is also aided by being able to trigger from either analogue or digital sources. These acquisition resources are further complemented by a set of measurement and analysis tools that operate on data from either domain.
Consider testing a fractional-N, PLL based, frequency synthesiser, intended for clock generation, its block diagram is shown in Figure 1.
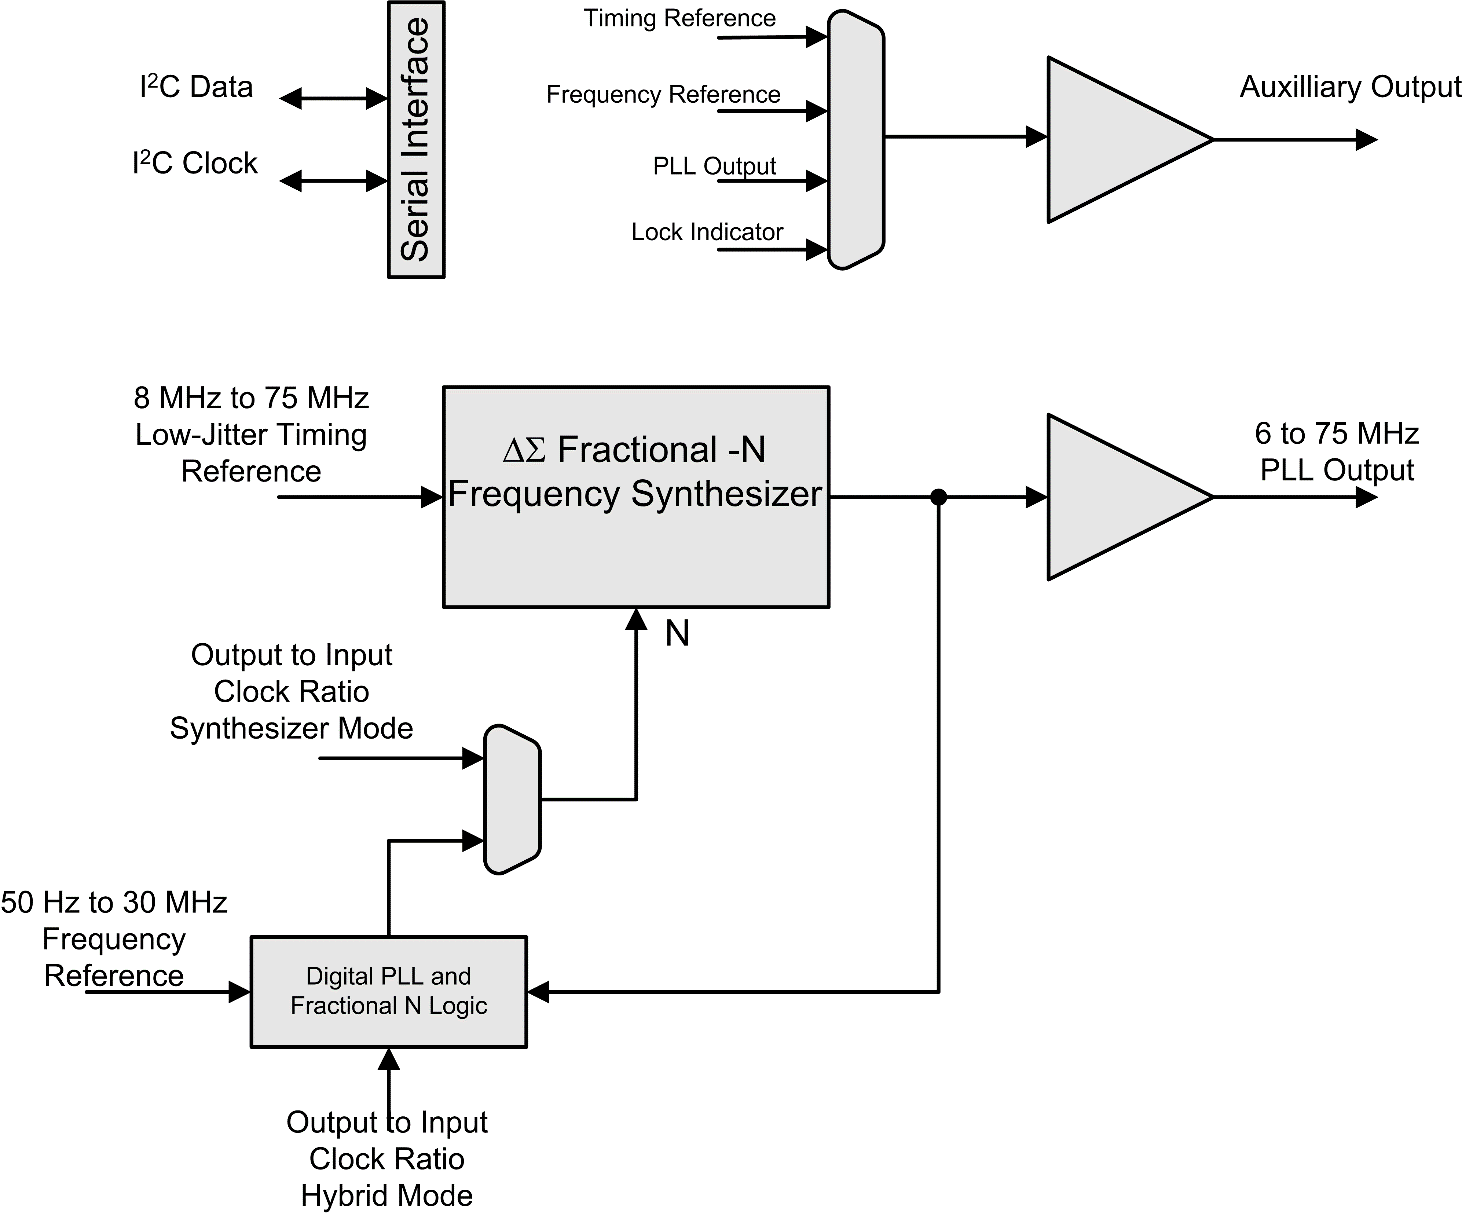
Figure 1: The block diagram of a PLL based Fractional-N frequency synthesiser intended for clock generation, is primarily an analogue circuit which employs digital control elements which are entered using a serial data interface.
This is basically an analogue circuit which is controlled by the contents of digital registers. It also provides an option to use an internal digital PLL to create a hybrid synthesiser. The register data content is entered via a digital serial interface, in this case an Inter-Integrated circuit or I2C. Additionally, the auxiliary output provides access to other digital signals like the PLL lock indicator. Testing this frequency synthesiser would benefit from a mixed mode measurement instrument.
It is an exciting development that Spectrum Instrumentation has added an 8-bit digital input option, (-DigSMA) to its existing M4i.44xx series of wideband PCIe digitiser cards as shown in figure 2.
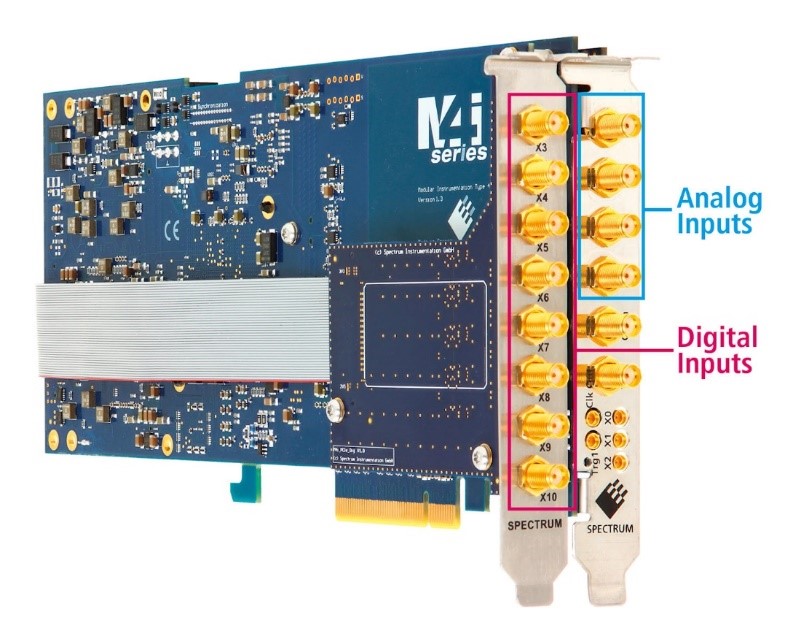
Figure 2: The -DigSMA option module adds 8 digital input channels to an M4i.44xx series digitisers.
Plugging these digitiser cards into a PC turns it into a fast and powerful mixed signal tester. The cards use an 8-lane Gen2 PCIe interface that is capable of transferring data to and from the PC at speeds up to 3.4 GB/s. This makes them suitable for applications where automated mixed signal testing needs to be made as quickly as possible.
The M4i.44xx series offers eight different models with two or four analogue channels sampled at 180 or 250 Mega samples per second (MS/s) with 16-bit resolution or 400 or 500 MS/s with 14-bit resolution. The analog bandwidth of the M4i.44xx digitisers ranges from 65 to 250 MHz depending on the model selected. For example, the M4i.4451-x8 shown has four analogue channels each with 14-bit amplitude resolution and an analogue bandwidth of 250MHz at a sampling rate of 500 MS/s.
The M4i.44xx-DigSMA digital input option uses an additional PCIe faceplate with eight SMA connectors for the digital inputs, which requires an additional PCIe slot. The digital inputs are designed for versatility, each input has an impedance of 10 kOhms (to 3.3V). This allows the inputs to handle 3.3V LVTTL signals with input voltage levels between -0.5V and +4.0V.
The digital input bandwidth is 125 MHz and software selection enables both synchronous and asynchronous acquisition modes. The acquired data, both digital and analogue, is stored in 2 Giga Samples of on-board acquisition memory. The digitiser also allows the data to be transferred to the PC in a variety of memory efficient read-out modes including multiple (segmented) acquisition, gated sampling and FIFO streaming.
Applications requiring higher channel counts can use the Spectrum Instrumentation Star-Hub expansion module. Star-Hub permits up to eight cards to be linked together by sharing a common clock and trigger. For instance, by simply connecting together three M4i.4451-x8 digitisers, two with the M4i.44xx-DigSMA digital option and one with the star-hub option, a single system can be made that has 12 analogue and 16 digital channels. Expandability is a major advantage of modular systems.
This digitiser family is a good choice to measure this synthesiser’s RF analogue signals and simultaneously acquiring and measuring the related digital signals.
Testing the I2C serial bus with both analogue and digital channels
The I2C bus is a relatively low speed serial communication bus. Bus speeds are 100 kbit/s for standard mode, 400 kbit/s in full speed, 1 Mbit/s for fast mode, and 3.2 Mbit/s in high speed mode. These are the maximum clock specifications for each mode. Testing of the I2C physical layer looks at signal amplitudes, data rates, and transition times. It may also require evaluation of noise, amplitude, and frequency stability.
Analogue measurements handle these elements by evaluating signal amplitude versus time with an amplitude resolution of the digitiser. Digital measurements, on the other hand, look at the data states as a function of time.
Each digital trace represents a single bit, sampled at the digital sampling rate. The amplitude basically varies from logical 0 to logical 1 based on whether it is lower or higher than the preset logic threshold. Digital waveforms are concerned with assuring data content and verifying proper protocol structure. If you compare analogue and digital measurements it is easy to see the difference as shown in Figure 3.
The analogue and digital versions of the I2C data signal are compared using Spectrum Instrumentation’s SBench6 control and signal processing software. SBench 6 is a very handy tool for operating the digitiser and displaying and analysing the acquired data.
Alternatively, the digitiser can also be controlled directly by the user. Software drivers allow customised setups that can generate perfectly matching mixed mode solutions. The digitiser and digital option are fully supported by a complete Software Development Kit (SDK) which includes programming using C++, C#, VB.NET, Python, JAVA, LabVIEW or MATLAB. The SDK is included as standard with every unit.
The signal is the upper left grid of Figure 3 is the analogue version of the I2C data signal. Below it is the digital version of the same signal which shows only the digital state 1 or 0. The same signals are horizontally expanded in the grids to the immediate right of each signal. Comparing the analogue and digital signals in the centre column noise can be seen on the upper analogue display that is not apparent on the lower digital signal.
The analogue signal analysis is based upon 14-bits of amplitude resolution while the digital representation is basically a single bit. Horizontally expanding the signals further, as show in the right-hand column, the analogue signal shows a finite risetime while the digital signal has an instantaneous transition between logic states, again it only has a single bit of resolution.
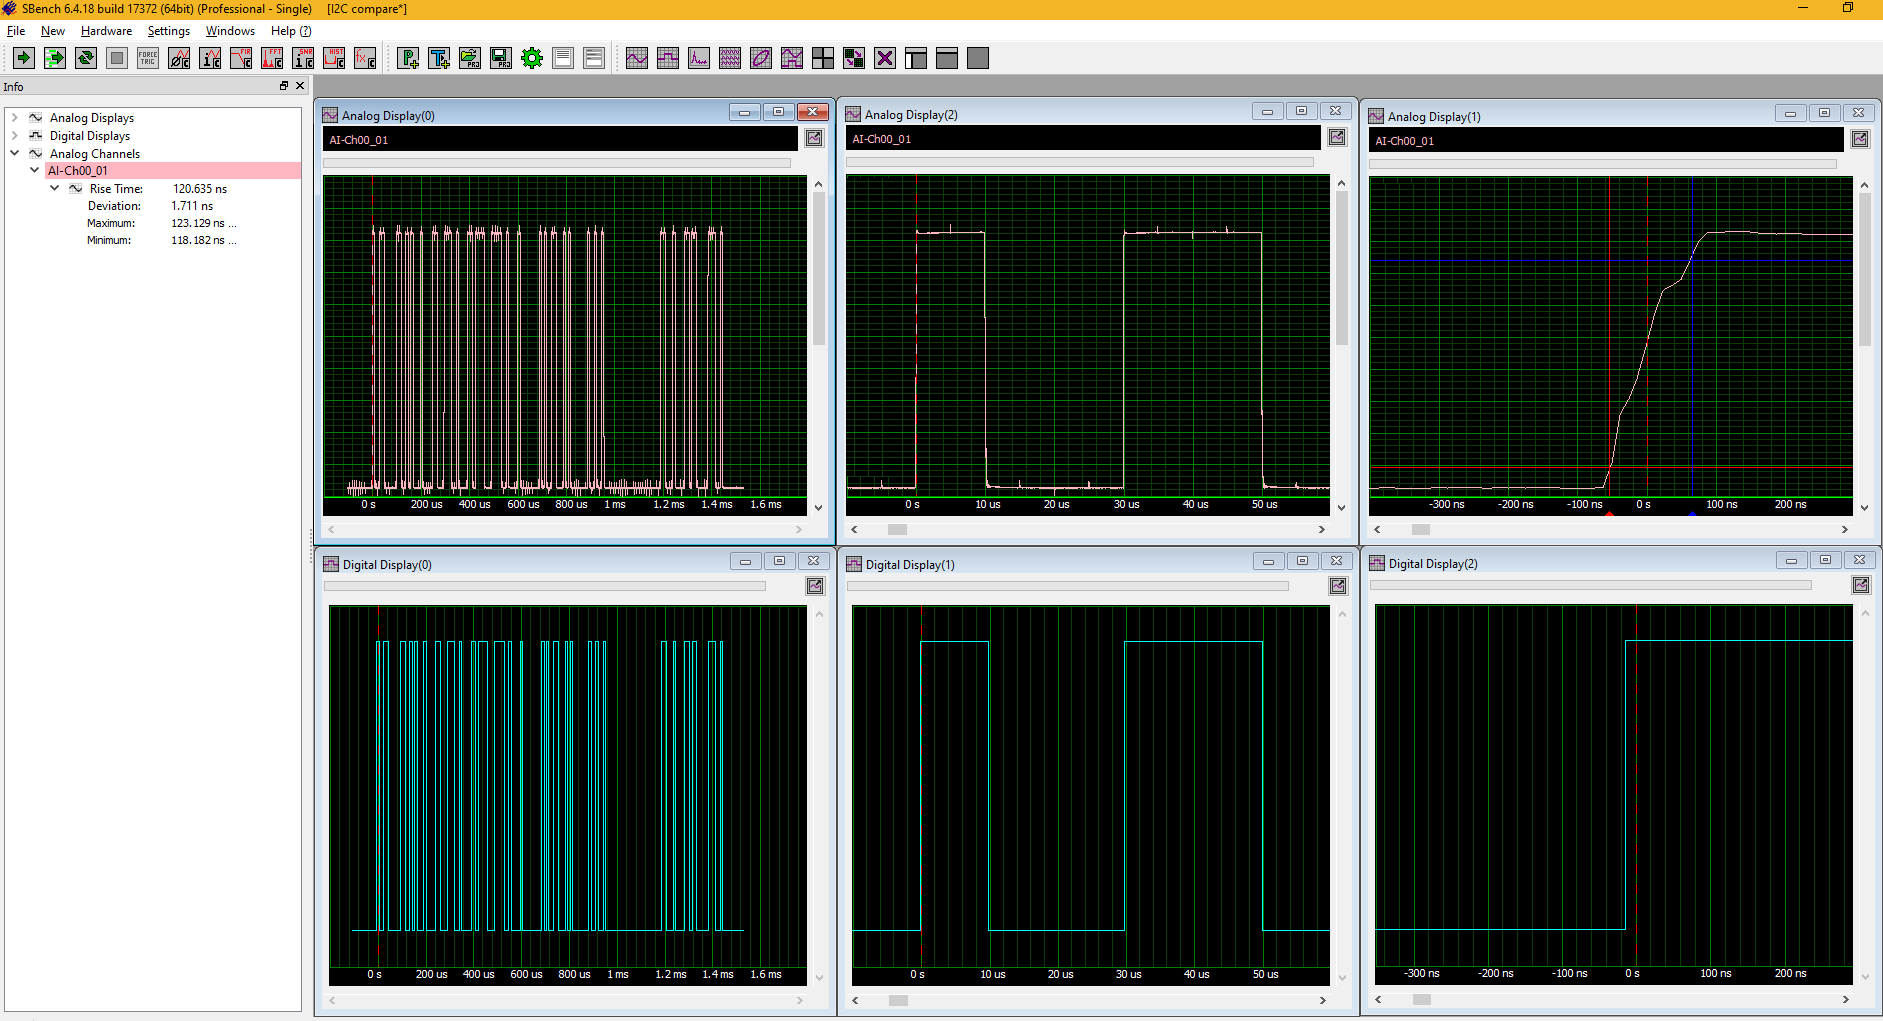 Figure 3: examining the differences between the analogue and a digital version of an I2C data signal. The digital version plots logic state versus time while the analogue version, with greater amplitude resolution, shows things like transition times, noise, and other details.
The digital version is used to evaluate the data state and can be decoded to provide the protocol content. The analogue acquisition provides the full details of the waveform.
Phase synchronisation of the analogue and digital signals is maintained by placing the one-bit digital signals in the high order bits of the analogue waveforms. As an example, if an M4i.4421-x8 16 bit digitiser is operating with all 4 analogue channels in use then the resolution of the analogue channels is reduced from 16 bits to 14 bits and two of the digital signals are appended to each analogue channel of the digitiser.
The SBench6 software can make automatic measurements for the most common signal parameters including frequency, duty cycle, pulse width, amplitude, rms, rise time, fall time, and many more. The cycle timing parameters such as frequency, pulse width, and duty cycle can be made on the digital waveform.
All the parameters including the amplitude related parameters such as amplitude, rise time, fall time, and rms as well as cycle-based parameters can be measured on the analogue waveforms. The risetime of the analogue signal is shown being measured in the figure.
Digital information in SBench 6 can be displayed in two forms. The digital waveforms can be displayed individually in a line view, sometimes called a ladder display, or bundled as a bus view; examples of both views are shown in Figure 4.
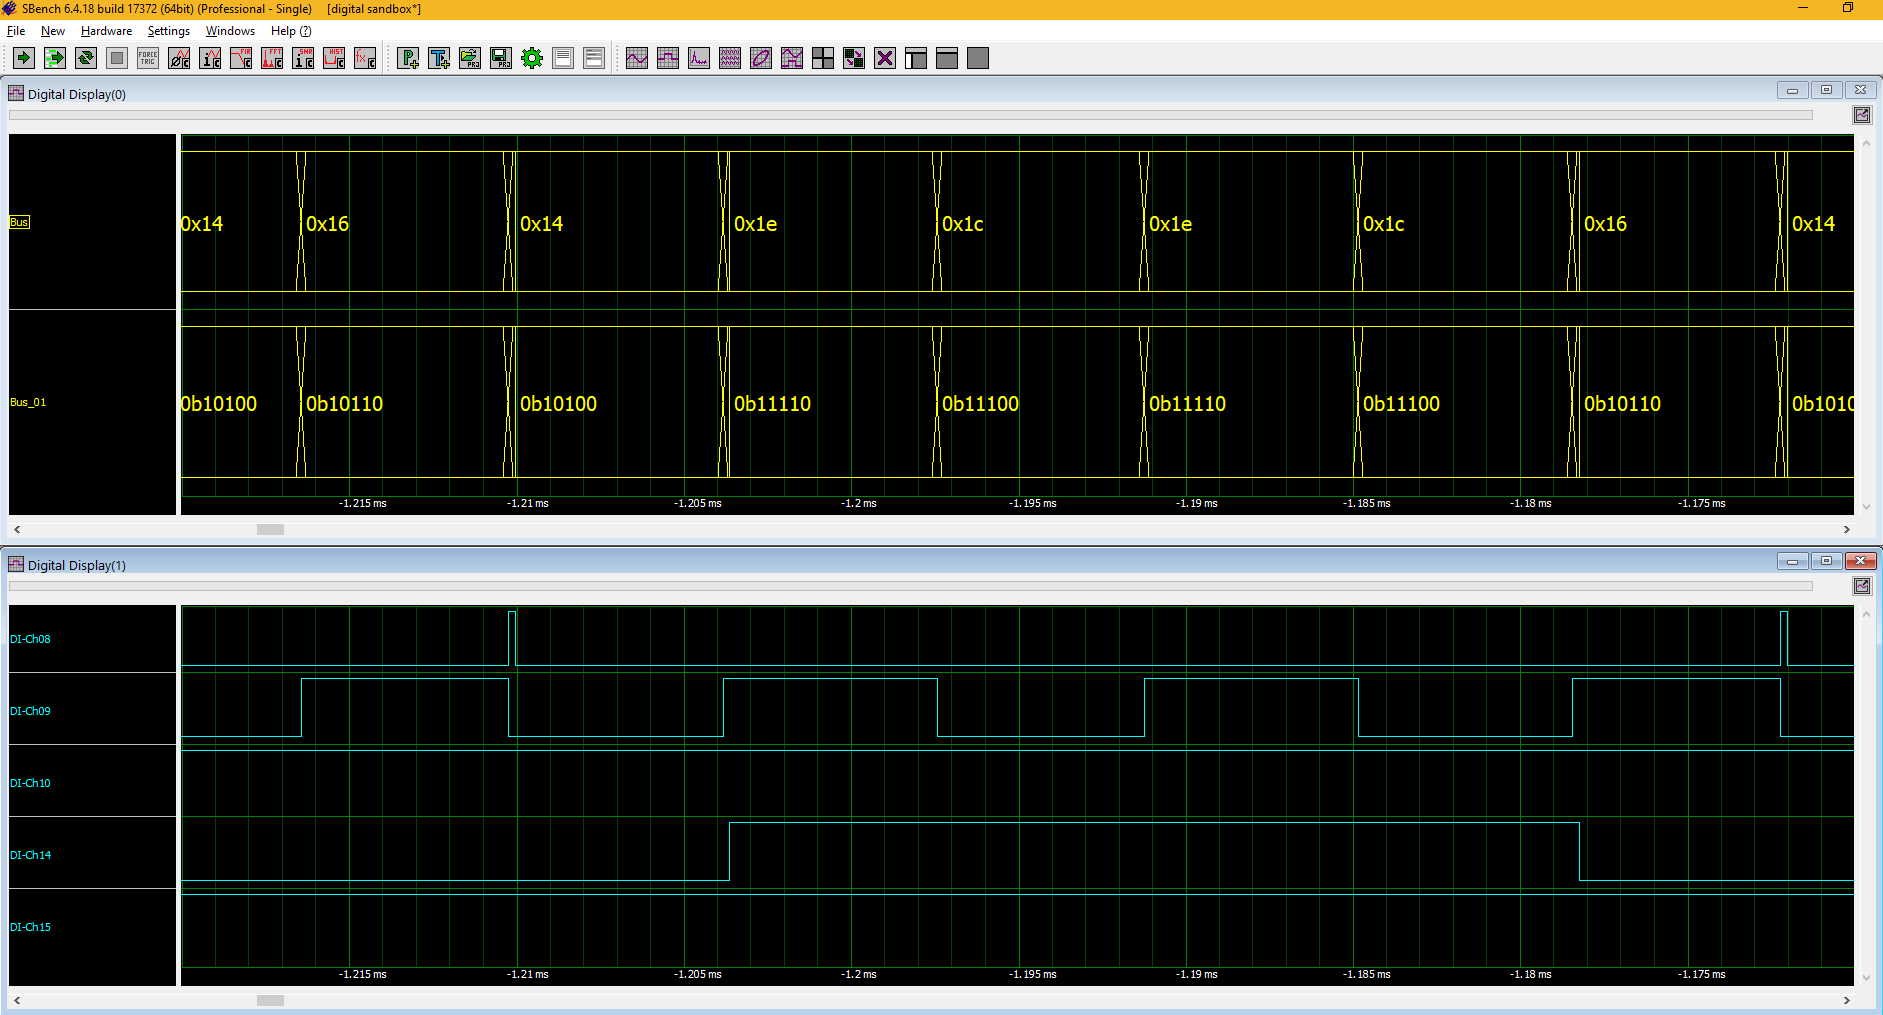 Figure 4: The two digital waveform viewing formats. Bus view on the top and line or ladder view in the lower grid of the same digital signals. Bus value readouts can be in binary (as shown), hex, octal, signed, or unsigned decimal.
The digital signals can be viewed individually in a line or ladder display as seen in the lower grid. They can also be combined into a group or bus view as shown in the upper grid. The bus view is annotated in the expanded view of the bus to show the bus state. The annotation shows the bus value in binary (as shown), hex, octal, as well as both signed and unsigned decimal formats.
Two or four analogue channels
The analogue channels of the M4i.44xx-x8 digitisers provide two or four channels of 14 to 16-bit resolution over amplitude ranges from ±200 mV to ±10V with model dependent bandwidths of 65 to 250 MHz. It is important to keep measurement bandwidth in mind.
For example, the synthesiser we are discussing produces a square wave output. If the frequency is set to 50MHz, then waveform amplitude dependent measurements like rise time or fall time requires that the measurement bandwidth be great enough to pass the signal’s harmonics.
Current practice is to pass up to the fifth harmonic. For a 50MHz rectangular square wave clock would require a measurement bandwidth of 250MHz. Figure 5 shows the acquisition and measurement of the 50MHz square wave clock, again using SBench 6.
The upper grid in the figure shows and expanded or zoom view of the 50MHz clock. The lower grid contains the Fast Fourier Transform or FFT of the clock signal. The FFT shows the frequency domain view of the clock signal with a fundamental spectral component at 50MHz as well as the third harmonic at 150MHz and the fifth harmonic at 250MHz.
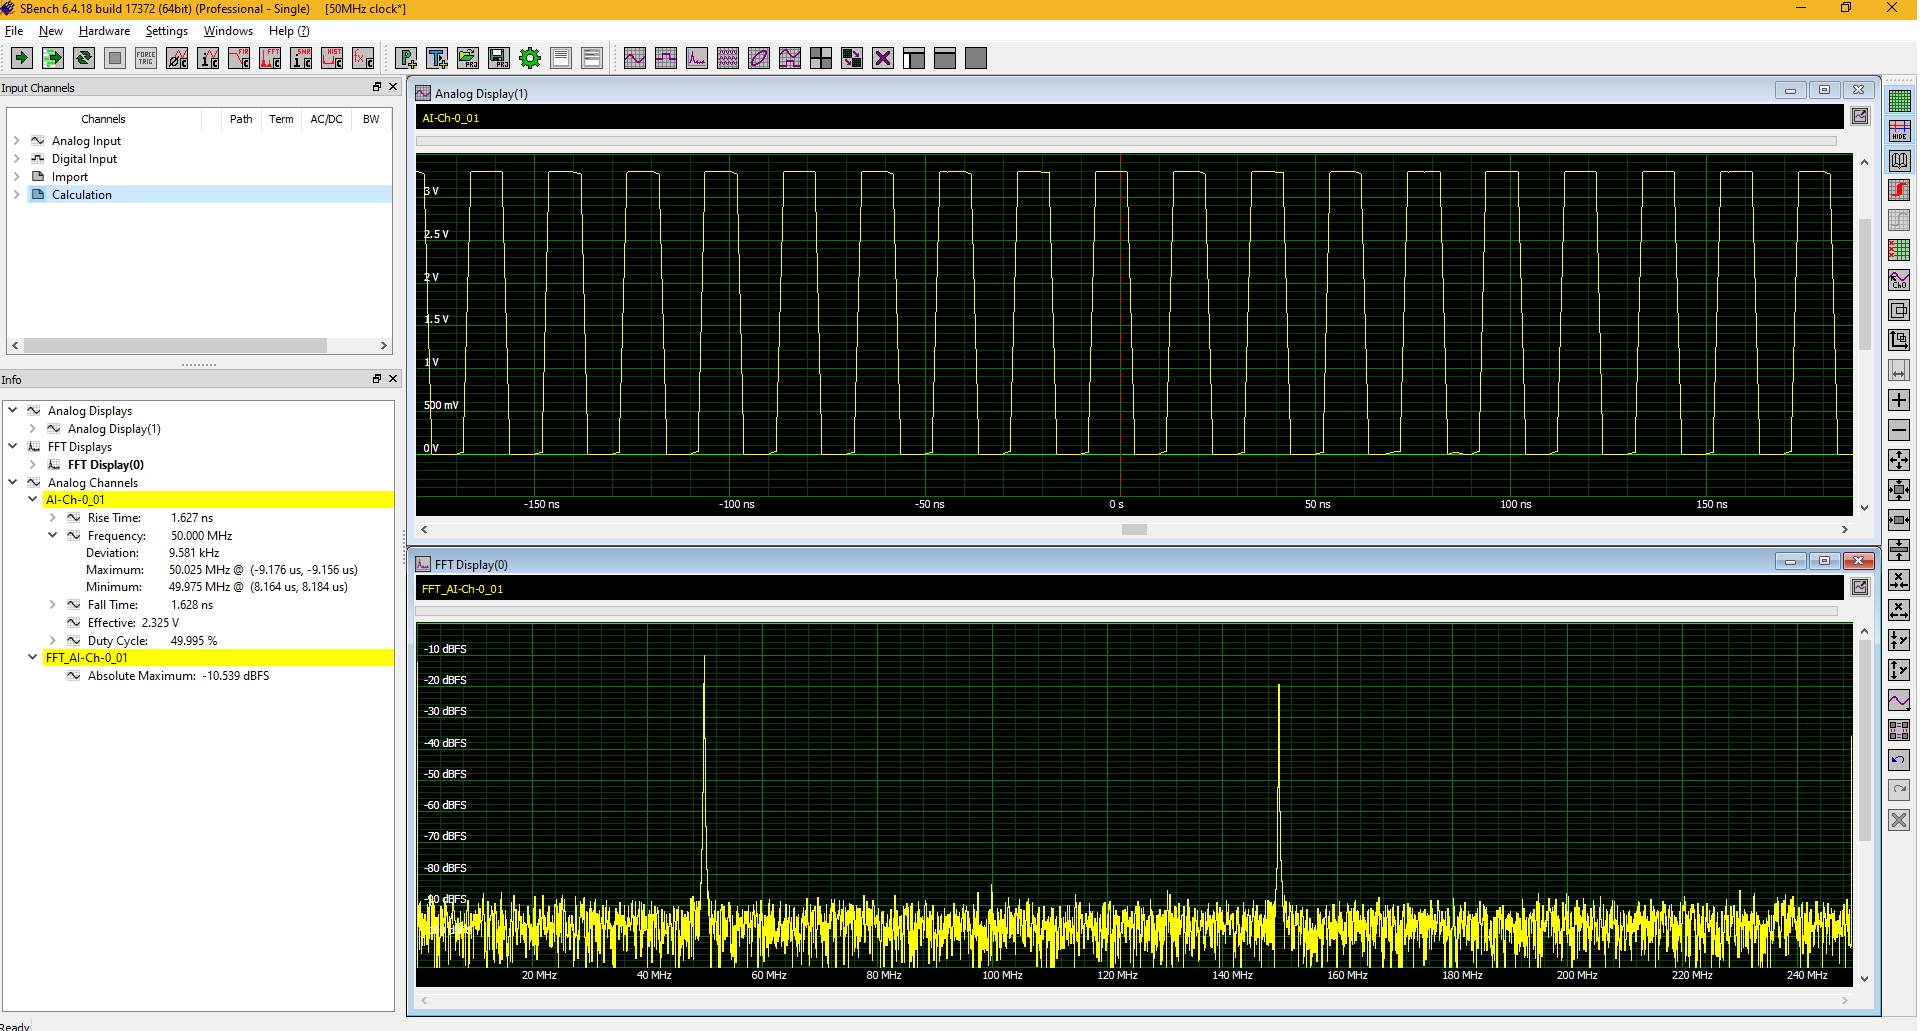 Figure 5: The acquisition and measurement of a 50MHz clock from the frequency synthesiser along with the FFT of the clock signal showing the significant harmonics.
The harmonics contribute a significant fraction of the signal’s waveform. Without sufficient measurement bandwidth the time domain waveform would be distorted. Since this digitiser has sufficient bandwidth for the 50MHz clock waveform measurements can be performed as shown.
The information panel on the left shows measurements of the clock signal’s rise time, frequency, fall time, effective (rms) voltage, and duty cycle. The frequency measurement has been expanded to show the available measurement statistics including maximum, minimum, and standard deviation.
Measurements can also be applied to the FFT. The peak amplitude of the fundamental frequency is measured as --10.539 decibels below full Scale (dBFS).
Mixed Signal Measurements
There are a number of measurements that involve both analogue and digital measurements simultaneously. Consider again a PLL. Combining the analogue input and output signals with the 'unlocked' digital signal it is possible to identify the cause of the unlocked condition. This is shown in Figure 6.
The 'unlocked' digital status signal indicates that the PLL input and output are no longer phase locked. By plotting the status signal along with the analogue input and output signals the cause of the unlocked condition is apparent at the beginning of the unlocked condition.
There is an abrupt phase shift in the input signal. This requires the PLL to adapt to the input phase change and the lock is lost while that happens. The resynchronisation process takes about 4ms. During this time, the 'Unlocked' indicator signal is in the high state.
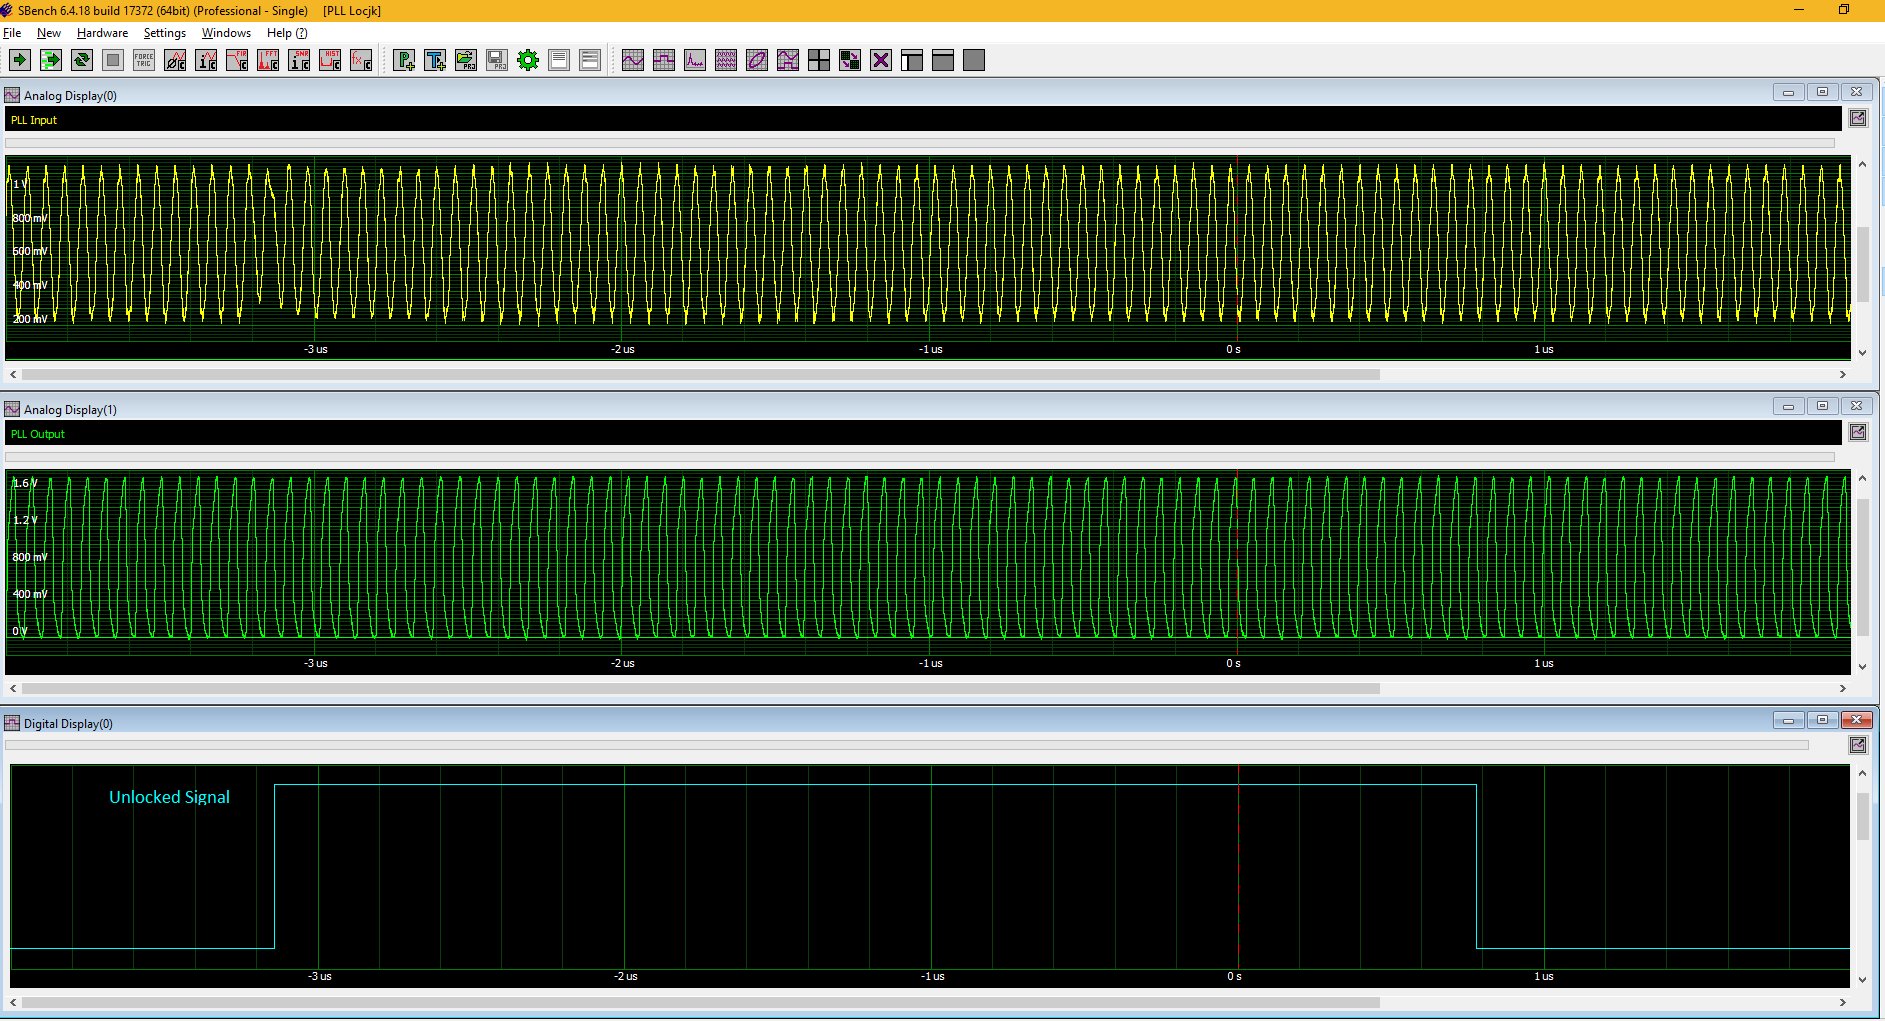
Figure 6: Combining the analogue input (top)and output (middle)waveforms of a PLL with the digital “unlocked” indicator signal(bottom) it shows the cause of the unlocked condition.
Other mixed signal measurements
Another common mixed signal device is the analogue multiplexer (MUX) or RF switch. The MUX has multiple inputs and a common output. Parallel digital address lines or a serial data interface address the MUX and send the selected input to the output. Figure 7 provides an example of a 16 channel MUX. There are 16 inputs which are selected based on the state of a four-bit parallel bus.
The upper grid contains a ladder diagram showing the four digital address lines S0 through S3. The least significant bit switches state every 12.5 µs producing 16 individual states over the 200ms measurement span.
Each binary state from 0000 to 1111 selects inputs 1 through 16 respectively. Inputs from 1 to 8 are sine waves with frequencies stepping from 1 to 8 MHz. Inputs 9 through 16 are also sine waves but with frequencies stepping downward from 8 MHz to 1 MHz. The digital signals are perfectly synchronised and aligned with the analogue signals which helps to mark and identify the transition points on the analogue waveforms.
The bottom grid is the FFT of the output and shows the eight frequency components over the full 16 channels. Note that the spectral lines are extremely broad. This is due to the truncated nature of each input segment.
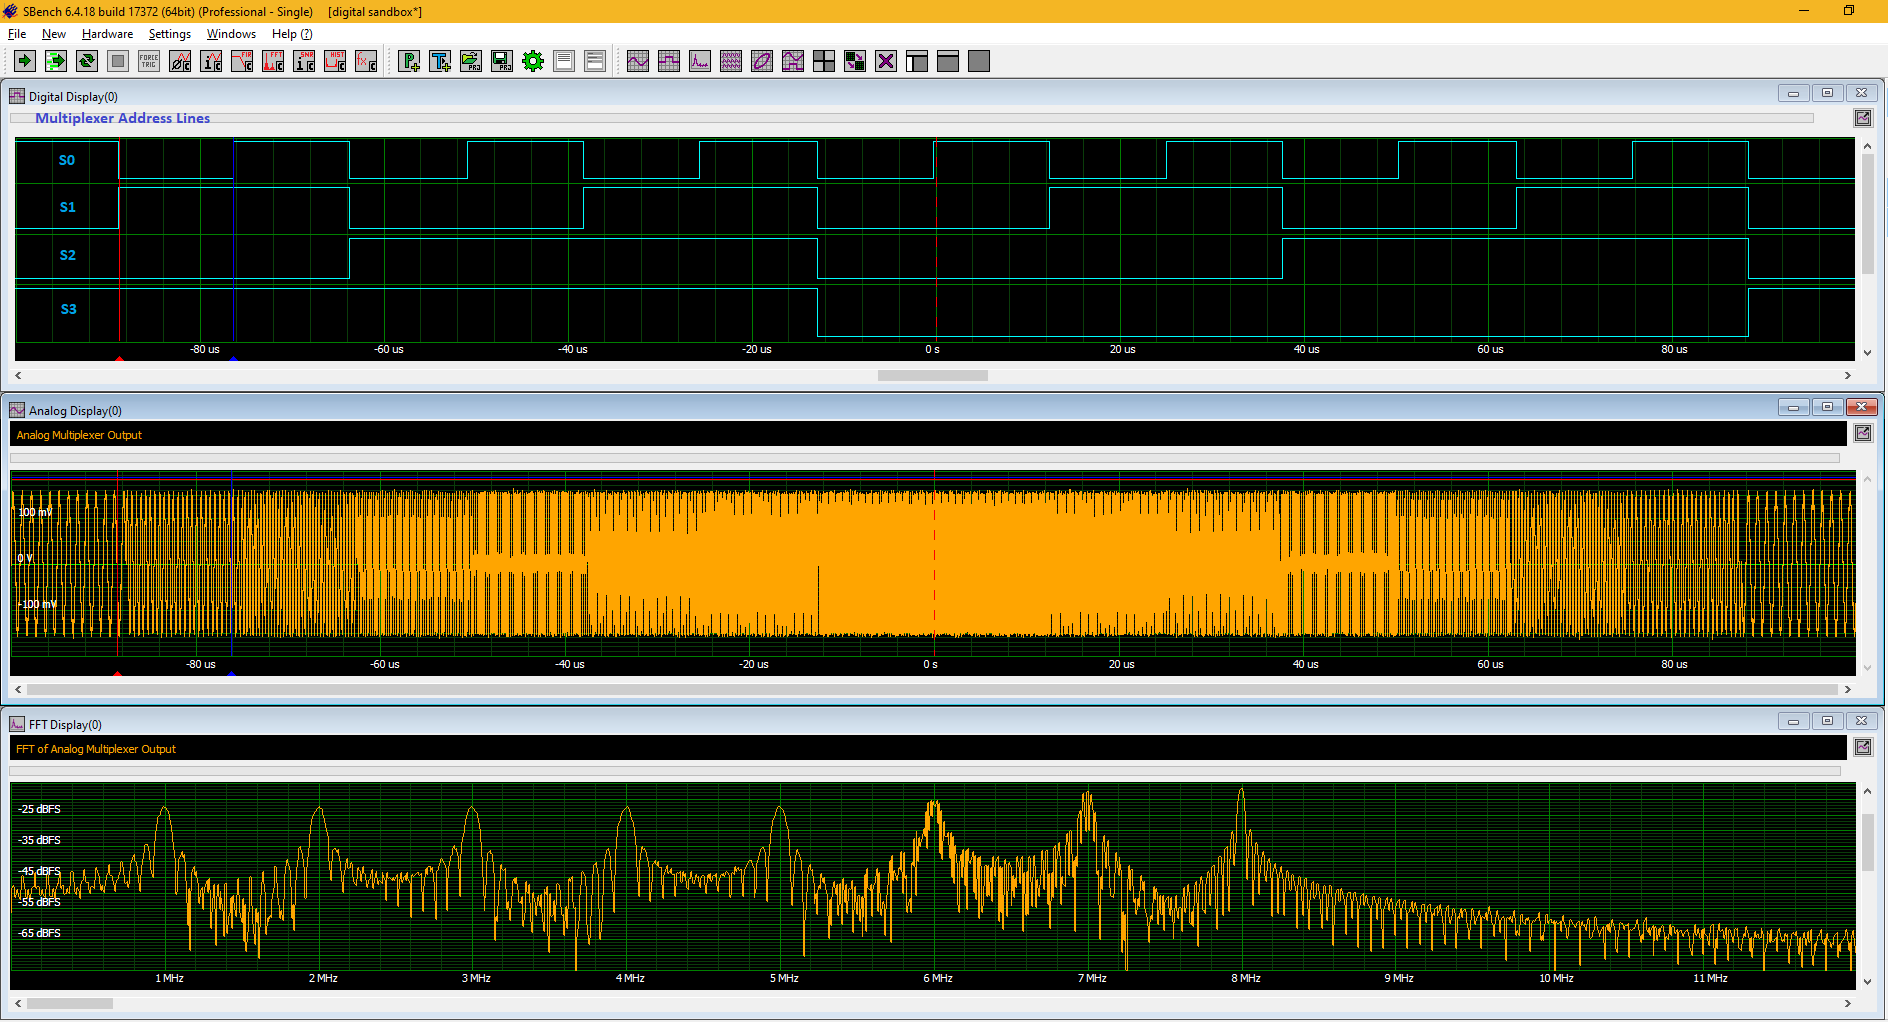
Figure 7: The digital address lines in the top grid select which input is connected to the output. The output signal is in the centre grid. The FFT of the output shows that there are eight distinct input frequencies from one to eight MHz.
The final example is that of an 8-bit DAC, used to provide a programmable DC offset, shown in Figure 8.
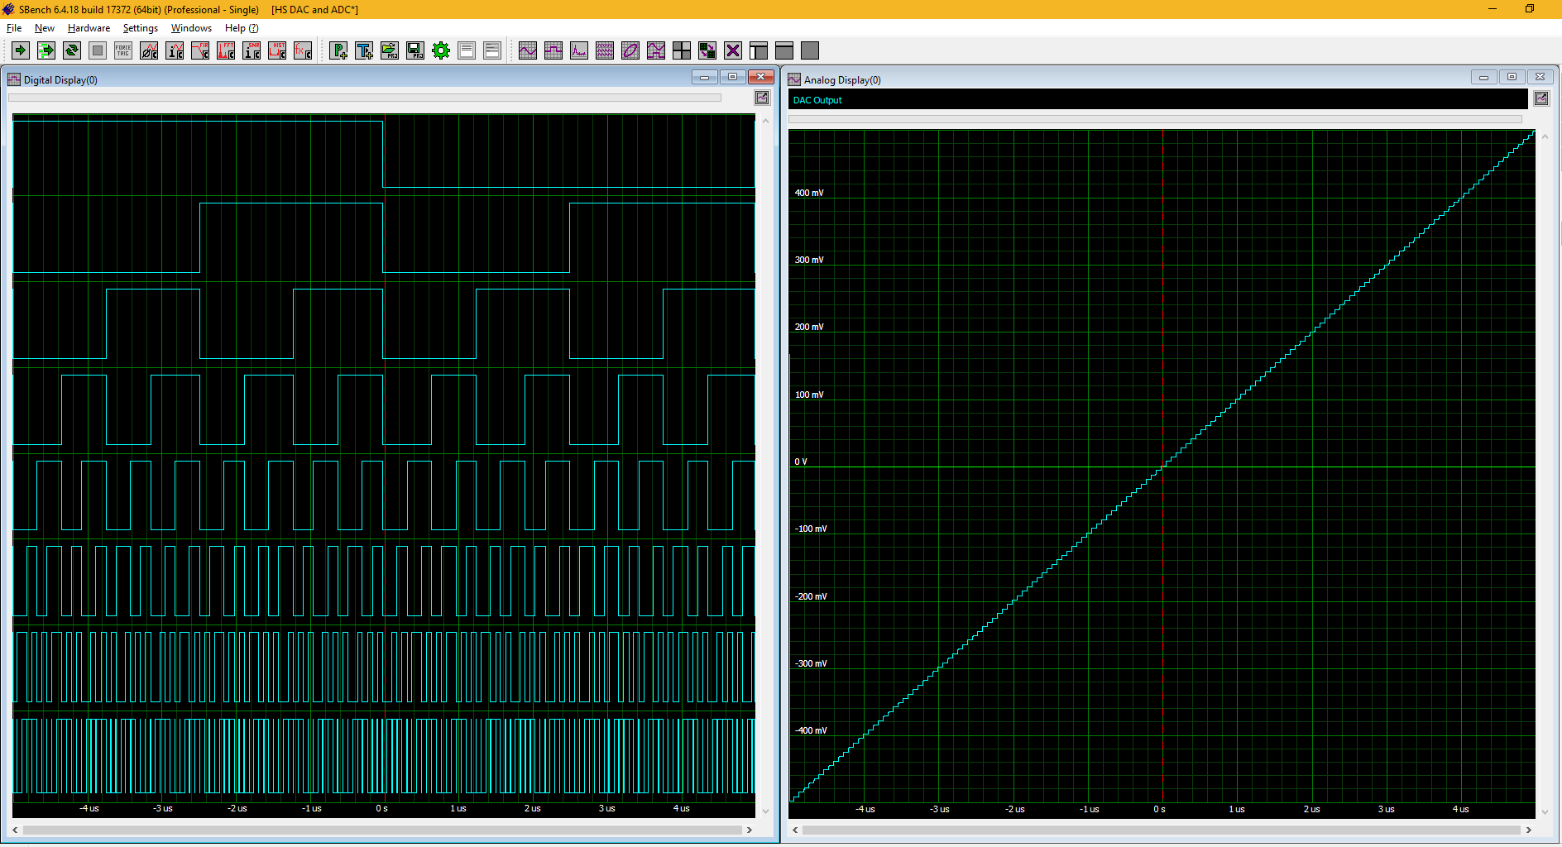
Figure 8: A mixed signal digitiser can see both the digital input (left grid) and output (right grid) of an 8-bit offset DAC
The ability to see both the digital input and the analogue output provides a troubleshooting tool for tracing any observed anomalies on the output and track them to the digital input bit.
Product Spotlight
APV1111GVY
Panasonic

Panasonic PhotoMOS® Photovoltaic MOSFET High-Power Drivers
| SKU: | |
|---|---|
| Stock: | 3490 |
| Cost: | $3.95 |
