
How to help save lives using AI
Technological advancements are changing every industry and healthcare is no exception: you can argue that the value of artificial intelligence (AI) is never greater than when it’s used to improve patients’ conditions and even save lives. Here, Haidar Altaie, Data Scientist, SAS UK & Ireland tells us more about how AI can help to save lives.
An example of how AI improves patient care is Amsterdam UMC’s partnership with SAS. The project was able to clinically diagnose patients with colorectal liver cancer, the third most common cancer worldwide, using Computer vision and predictive analysis. Previously, this process required manual examination which was time-consuming and subjective to the radiologist. Automating this process has increased accuracy and saved time to ensure patient survival.
Whether it’s image analysis to detect cancer or other diseases immediately, predicting the number of patients to ensure the right number of doctors and hospital beds are available or using natural language processing (NLP) to understand lengthy patients reports – the potential for technological enhancement in healthcare is colossal.
Stent Failure Overview
SAS hosted a Virtual Data Science Experience Day,where it presented how machine learning is used to reduce the risk of heart attacks by predicting stent failure. A stent is a small tube that doctors place in a blocked artery to help restore healthy blood flow. They are used to keep coronary arteries open and reduce the chance of a heart attack. Understanding and being able to predict the main drivers of stent device failure using advanced algorithms allows us to continuously improve the treatment and patient safety.
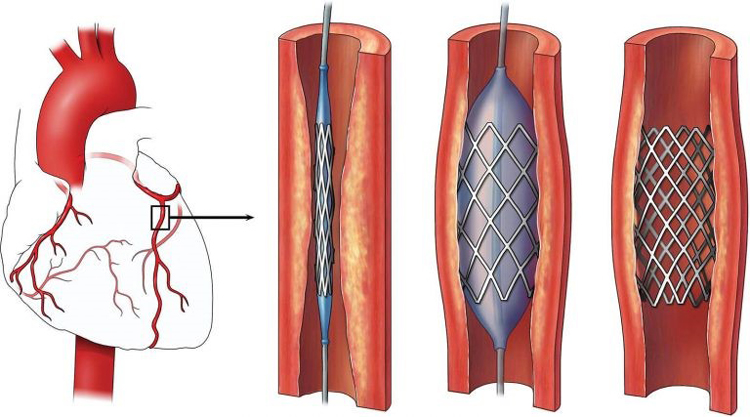
Figure 1. Stent with a balloon can be inserted into a blood vessel in the heart; a small balloon blows and then gets removed and then the stent keeps the vessel open.
Case Study: Predicting Stent Failure using Machine Learning
So how can we do that? We will be using analytical software to create a visual report and compare several supervised machine learning algorithms such as logistic regression, gradient boosting and neural networks. The data set will include variables about the patient (age, gender, smoker, diabetic etc.), stent (length, material, type, design etc.) and other external factors (e.g. the hospital). During my session at the online event we will go into detail on how we prepare and explore the data, as well as discussing how we can make our models more accurate. However, for this blog we will just look into the principles of the method to predict stent failure.
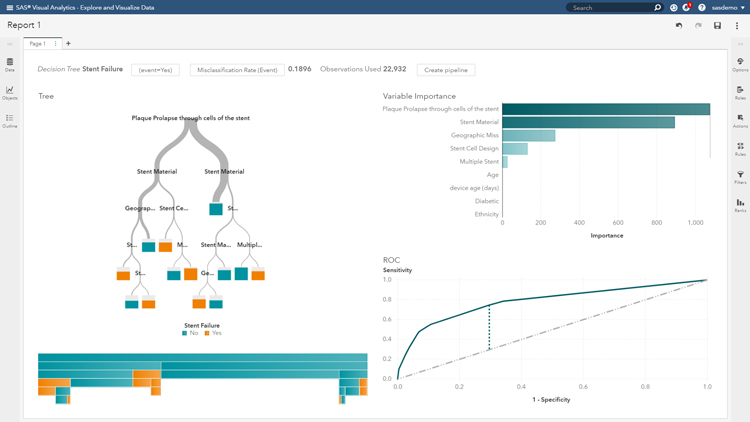
Firstly, we want to explore a decision tree from the objects panel and include all the variables, as this allows us to classify the variables to study the variable importance. From this decision tree, we can see a misclassification rate of 0.1896 – which means that this model can accurately predict around 81 per cent of cases which lead to stent failure. We can see variables such as Plaque Prolapse through cells of the stent and Stent Material are the top two variables in determining stent failure. Simply speaking, this means we could dive deeper into which material has a high failure rate and improve, or even eliminate, that material.
In the options panel (top right), we can optimise our parameter to get an improved model. For example, you can see in the image (below) that it splits the decision tree into two categories (or branches) each time. Using a potential 3 branches will improve the model slightly. This would decrease our misclassification rate to 0.1866 and slightly improve our model. Our aim in this session is to minimise the misclassification rate.
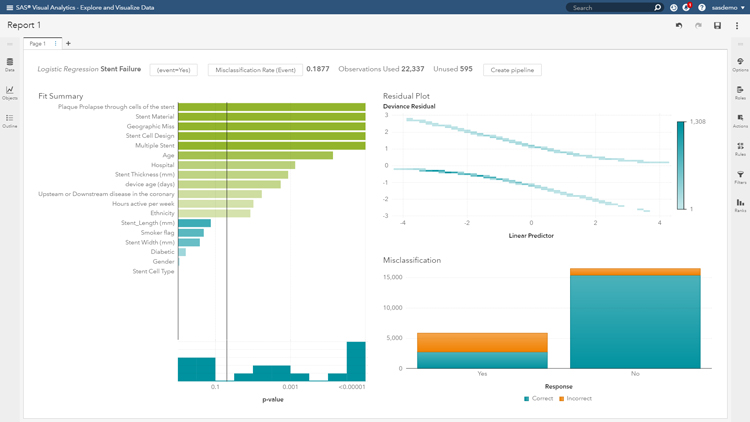
Since we are trying to predict a binary outcome (failure/non-failure), another machine learning technique we could use is a logistic regression. This is a simple, fast yet powerful classification algorithm. If you are worried about which machine learning algorithms to use, we can discuss that during my live session at the Data Science Online Event. Until then, a good starting point can be found here.
We can see that logistic regression produces a slightly improved misclassification rate of 0.1877. This again shows which variables are statistically significant in determining whether the stent device fails by displaying its p-value.
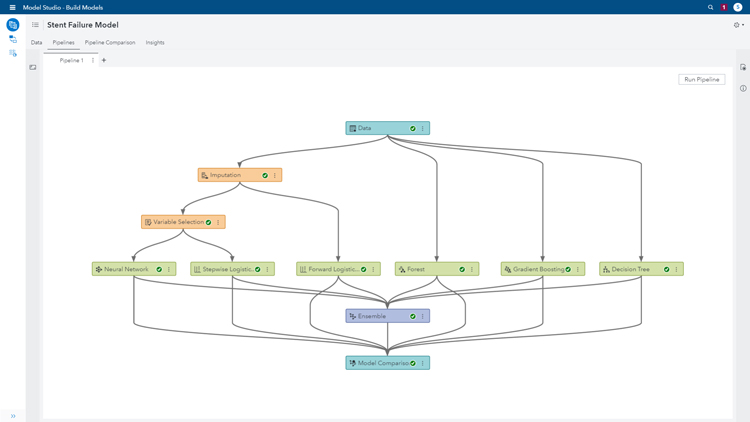
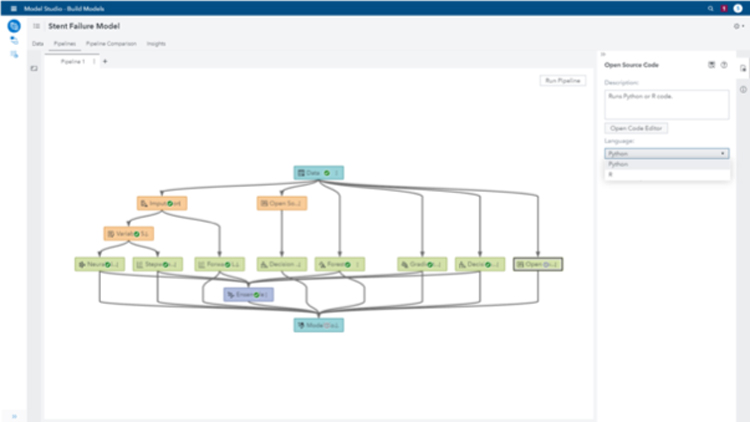
This process is great to look at single models and study the results. However, in a business process, we would like to compare several models and get detailed insights – thus we will move onto a ‘modelling studio’ which can help us develop the entire end-to-end analytics life cycle in the form of a ‘pipeline’ (an intelligent process flow). In this process, we can easily drag and drop data mining pre-processed to prepare the data for modelling (e.g. we will use the ‘imputation‘ node to replace missing data to improve data quality and model accuracy, and ‘Variable selection’ to select the best variables for analysis). We can then select which machine learning technique we wish to use, and we’re able to adapt it too.
SAS loves Open Source
So far, we’ve been using SAS (code) throughout this exercise. However, SAS embraces open source and allows you to use this with whatever language you prefer. You can perform your data mining via Python or R, and then apply the machine learning techniques, or you could create an entire process in open source and compare it against the SAS models to pick the best one.
Flexibility is at the forefront of what we want to achieve, and SAS Viya allows that.
Results of the Case Study
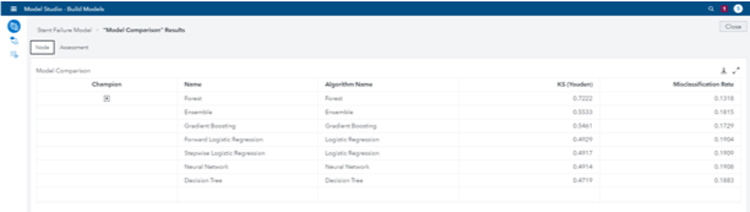
We added several data mining pre-processers and machine learning techniques to compare in order to pick the best model. In this case, we can see that the technique with the lowest misclassification rate was Forest with 0.1318 after opening the ‘model comparison’ node. This will be selected as the ‘champion’ model.
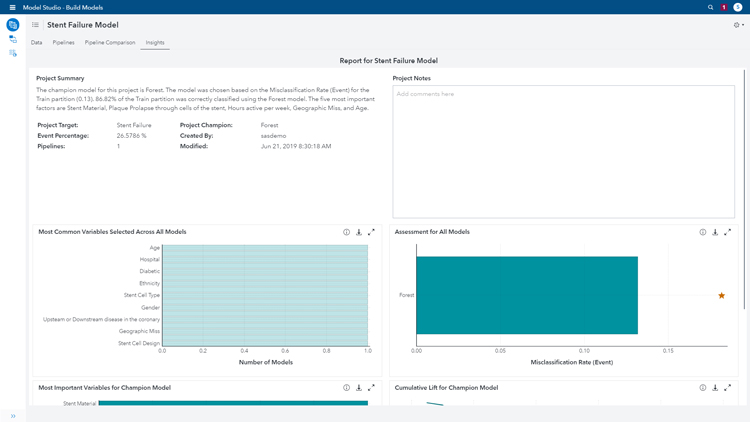
We can select the ‘insight’ tab on the top left to get an overview of the result. This gives us a project summary, explains the variable importance and shows project logistics. We created one pipeline in this example. However, in a bigger project, we could create several pipelines to compare against each other.
The project summary states “The champion model for this project is Forest. The model was chosen based on the Misclassification Rate (Event) for the Train partition (0.13). 86.82% of the Train partition was correctly classified using the Forest model. The five most important factors are Stent Material, Plaque Prolapse through cells of the stent, Hours active per week, Geographic Miss, and Age.”
This process has allowed us to use sophisticated machine learning techniques, and compare them against each other in a simple, flexible and open interface. For these reasons, it’s unsurprising to see this product ranked as the standout “Leader” in the Forrester Wave and as a “Leader” in the Gartner MQ.
Product Spotlight
APV1111GVY
Panasonic

Panasonic PhotoMOS® Photovoltaic MOSFET High-Power Drivers
| SKU: | |
|---|---|
| Stock: | 3490 |
| Cost: | $3.95 |
