
European electronic components market trends Q4 2019
The European electronic components Distributor Total Available Market (DTAM) continued to decline into the fourth quarter of 2019, Adam Fletcher, Chairman of the International Distributors of Electronics Association (IDEA), has repoted.
Consolidated returns from the association’s member companies reveal that average ‘Billings’ (sales revenue invoiced, less credits) declined by (10%) in Q4’19 when compared to the same calendar quarter 2018, confirming a third quarter of decline and continuing the current period of technical recession (i.e. more than two consecutive quarters of decline).
The growth in the European electronic components market in 2019 slowed to just (0.9%), exacerbated by manufacturer lead-time reductions for electronic components, a global economic slowdown, ongoing trade wars and Brexit. IDEA members had forecast stronger growth in the second half of the year, but the improvement failed to happen. Historical precedence and the improving B2B ratio are pointers towards a very welcome uptick in Q1’20.
Each month IDEA collates the statistical data reported by its member associations throughout Europe and consolidates the figures before publishing them as headline information.IDEA uses three primary metrics in its reporting process: ‘Billings’ (sales revenue invoiced, less credits), ‘Bookings’ (net new orders entered), and the ratio of the two known as the ‘Book to Bill’ (or B2B) ratio.
All three metrics are important, but the consolidated ‘Billings’ number is possibly the most critical: “The Billings metric is the most accurate indicator of the performance of all organisations operating in the market”, says Fletcher. “Organisations are able to use this figure to compare their actual operating performance with the market’s average sales revenue performance”.
The data presented in the following graphics is shown in K€ Euros and where necessary has been converted from local currency at a fixed exchange rate for the year.
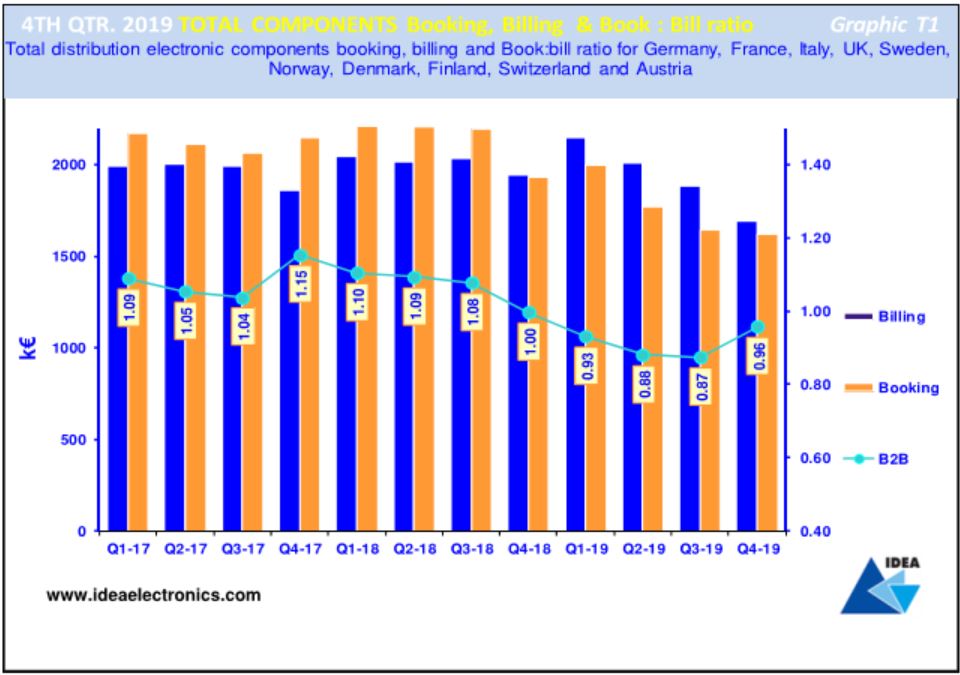
Q4’19 Bookings, Billings & B2B - Graphic T1
Graphic T1 is a visual representation of twelve quarters of ‘Billings’ and ‘Bookings’ together with the corresponding ‘Book-to-Bill’ (B2B) ratios. A positive B2B number - i.e. greater than 1 – indicates growth in electronic components markets but a number below 1 is evidence of a decline.
A quick glance at the chart suggests that there has been a further decline in growth in the fourth quarter of 2019, which, is in line with IDEA member guidance and follows the historical trend. Further analysis reveals an improvement in the B2B ratio to 0.96:1 in Q4’19, suggesting that we may have reached the bottom of the current economic cycle and that sales revenue growth may well be set to return in Q1’20 in-line with the historical trend for European Electronic Components markets.
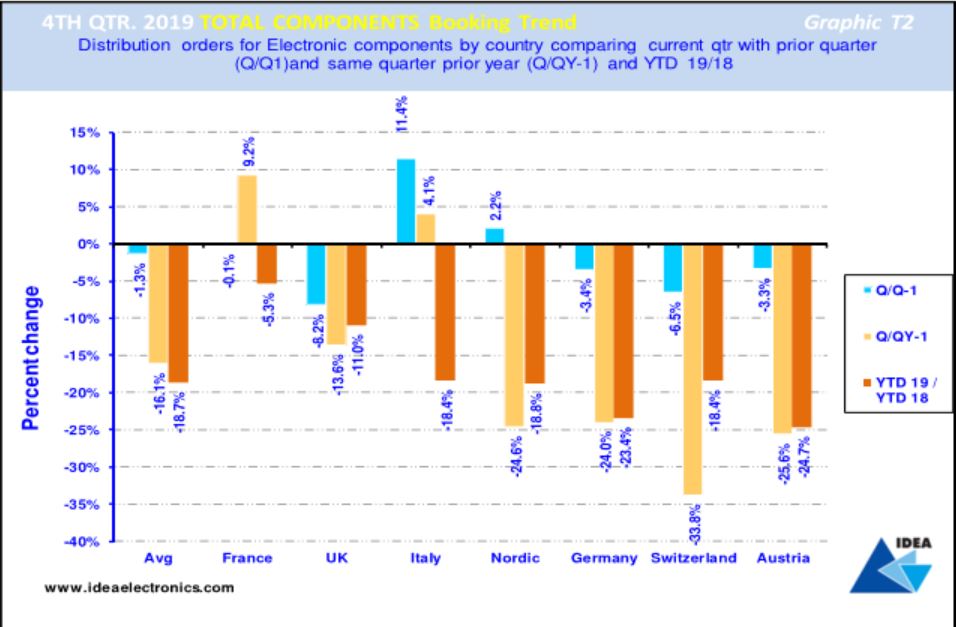
Q4’19 Bookings Trend -Graphic T2
Graphic T2 compares the total electronic components ‘Bookings’ result achieved in each European country in Q4'19 and contrasts and compares these figures with the result they achieved in the previous quarter and those achieved in the same period last year.
The blue bar reveals that on average European ‘Bookings’ declined by (1.3%) in Q4’19 when compared to the previous quarter.
The light brown bar compares ‘Bookings’ growth by country in Q4'19 with those in the same quarter 2018 and indicates that on average ‘Bookings’ declined by (16.1%), which is another sharp drop.
The dark brown bar compares average ‘Bookings’ achieved in Europe year-to-date with the same period in 2018, revealing that the average Bookings growth rate declined by (18.7%) across Europe over the 12-month period and confirming that the European market continues to slow rapidly.
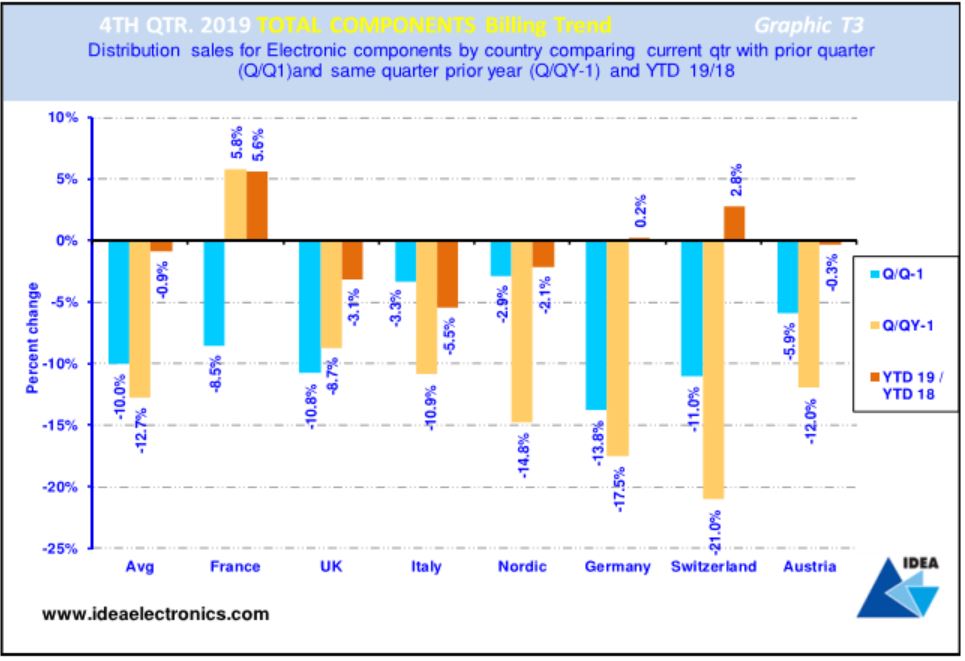
Q4’19 Billings Trend -Graphic T3
Graphic T3 illustrates total electronic components ‘Billings’ achieved in European markets in Q4'19 and contrasts and compares the results with the previous quarter's results and those achieved in the same period last year.
The blue bars compare Q4’19 ‘Billings’ with the preceding quarter’s figures, revealing that all European electronic components markets experienced an average (10%). decline in growth over the period.
The light brown bars compare Q4’19 with the same quarter last year and shows that most European electronic components markets suffered in the quarter, with an average decline of (12.7%).
The dark brown bars compare current YTD ‘Billings’ with the same period 2018, revealing an average decline of (0.9%) across European Components Markets, which confirms a third quarter of a minor technical recession.
Product Spotlight
APV1111GVY
Panasonic

Panasonic PhotoMOS® Photovoltaic MOSFET High-Power Drivers
| SKU: | |
|---|---|
| Stock: | 3490 |
| Cost: | $3.95 |
