
European electronic components market trends Q1 2020
The European electronic components Distributor Total Available Market (DTAM) emerged from a technical recession and returned to growth in the first quarter of 2020, reported Adam Fletcher, Chairman of the International Distributors of Electronics Association (IDEA).
Consolidated returns from the association’s member companies reveal that average “Bookings” increased significantly compared to the previous quarter whilst ‘Billings’ also improved. These results have halted the preceding period of decline and ended the technical recession (i.e. growth after more than two consecutive quarters of decline).
Bookings tend to track the manufacturer lead-times for electronic components and the DTAM growth in Q1’20 reflects both the jump in lead-times and potential supply network issues as a result of the COVID-19 epidemic. IDEA members now forecast a further decline in ‘Billings’ throughout 2020, with a return to growth in 2021.
Each month IDEA collates the statistical data reported by its member associations throughout Europe and consolidates the figures before publishing them as headline information.IDEA uses three primary metrics in its reporting process: ‘Billings’ (sales revenue invoiced, less credits), ‘Bookings’ (net new orders entered), and the ratio of the two known as the ‘Book to Bill’ (or B2B) ratio.
All three metrics are important, but the consolidated ‘Billings’ number is possibly the most critical: “The Billings metric is the most accurate indicator of the performance of all organisations operating in the market,” said Fletcher. “Organisations are able to use this figure to compare their actual operating performance with the market’s average sales revenue performance”.
The data presented in the following graphics is shown in K€ Euros and where necessary has been converted from local currency at a fixed exchange rate for the year.
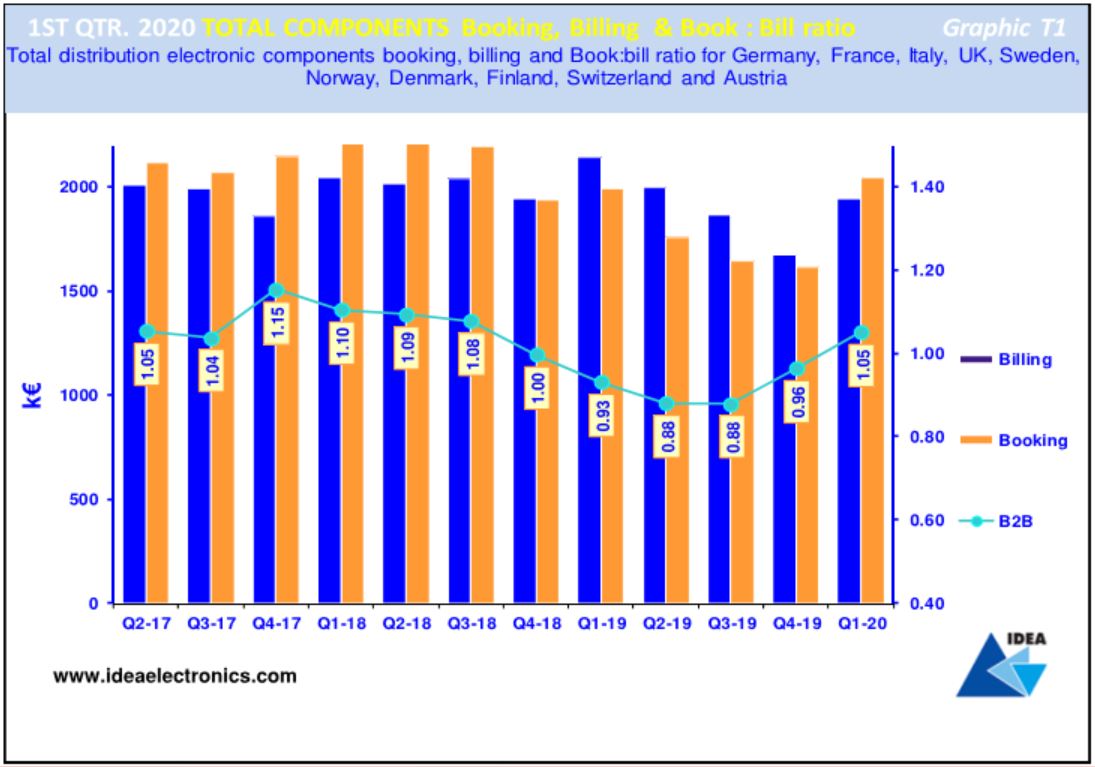
Q1’20 Bookings, Billings & B2B - Graphic T1
Graphic T1 is a visual representation of twelve quarters of consolidated European ‘Billings’ and ‘Bookings’, together with the corresponding ‘Book-to-Bill’ (B2B) ratios. A positive B2B number - i.e. greater than 1 – indicates growth in electronic components markets but a number below 1 is evidence of a decline.
A quick glance at the chart suggests that there has been a significant improvement in growth in both Bookings and Billings the first quarter of 2020, which is in line with IDEA member guidance and follows the historical trend for the first half of the year.
The improvement in the B2B ratio to 1.06:1 in Q1’20, suggests that customers are now generally increasing their order cover in response to current market uncertainties. The European electronic components market results for Q1’20 are surprisingly satisfactory given the scale of global economic damage caused by the COVID-19 epidemic.
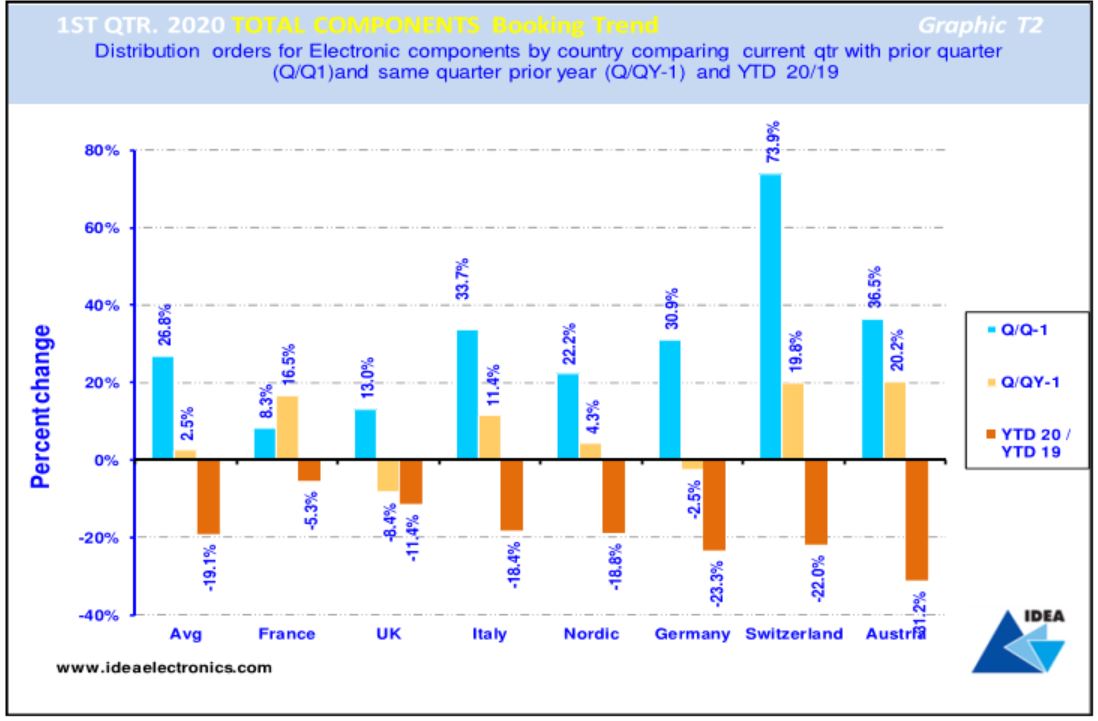
Q1’20 Bookings Trend -Graphic T2
Graphic T2 compares the total electronic components ‘Bookings’ result achieved in each European country in Q1'20 and contrasts and compares these figures with the result they achieved in the previous quarter and those achieved in the same period last year.
The blue bar reveals that on average European ‘Bookings’ increased by 27% in Q1’20 when compared to the previous quarter.
The light brown bar compares ‘Bookings’ growth by country in Q1’20 with those in the same quarter 2019 and indicates that on average ‘Bookings’ increased slightly by 3% in this period.
The dark brown bar compares average ‘Bookings’ achieved in Europe year-to-date with the same period in 2019, revealing that the average Bookings growth rate declined by (20%) across Europe over the 12-month period, confirming that despite an improving Q1 the European market on an annual basis is continuing to contract.

Q1 ’20 Billings Trend -Graphic T3
Graphic T3 illustrates total electronic components ‘Billings’ achieved in European markets in Q1’20 and contrasts and compares the results with the previous quarter's results and those achieved in the same period last year.
The blue bars compare Q1’20 ‘Billings’ with the preceding quarter’s figures, revealing that all European electronic components markets experienced an average growth of 16% over the previous quarter.
The light brown bars compare Q1’20 with the same quarter last year and shows that most European electronic components markets suffered in the quarter year-on-year, with an average decline of (10%).
The dark brown bars compare current YTD ‘Billings’ with the same period 2019, revealing an average decline of (2%) across European electronic components markets. However, the results for the current quarter have lifted the sector out of technical recession, at least for the time being.
Product Spotlight
APV1111GVY
Panasonic

Panasonic PhotoMOS® Photovoltaic MOSFET High-Power Drivers
| SKU: | |
|---|---|
| Stock: | 3490 |
| Cost: | $3.95 |
