
European electronic components market trends - Q2 2017
The growth in the European electronic components markets continued into the second quarter of 2017, prompting average manufacturer lead times to further extend as growth outpaced forecast demand. Further analysis of the data available to the International Distributors of Electronics Association (IDEA) and here provided by ECSN indicates that the growth in Europe began to slow as we entered the second half of the year, which is in line with historical trends.
The most obvious trend illustrated by Graphic T1 is that growth is gradual and that whilst the billings (sales revenue invoiced, less credits) growth has been pretty consistent in Q1 and Q2 ’17 bookings (net new orders entered) declined. Further, it shows that the B2B ratio declined from 1.09:1 to 1.06:1 in Q2 '17, suggesting that billings growth into the next quarter will likely follow suit.
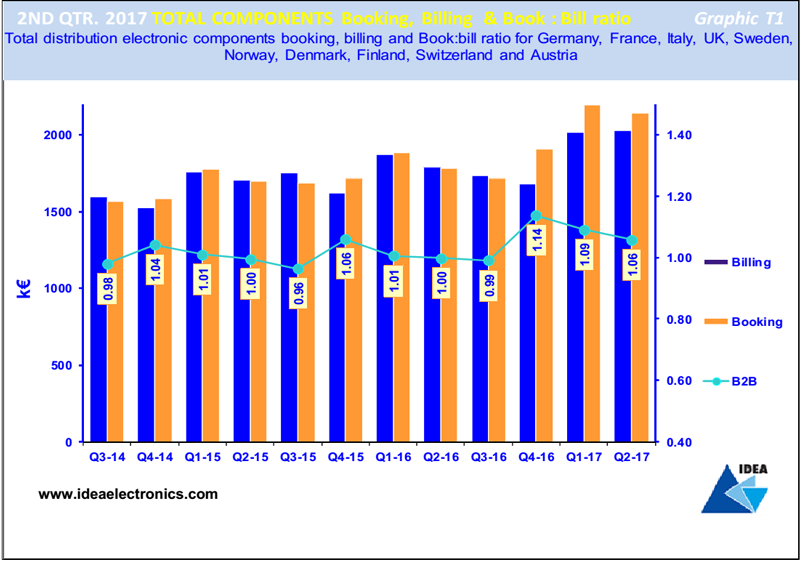
All three metrics are important and the link between them is obvious but the billings number is the critical value as it reveals the actual sales revenue performance of all organisations reported within the market and accordingly, is closely monitored by market analysts and shareholders.
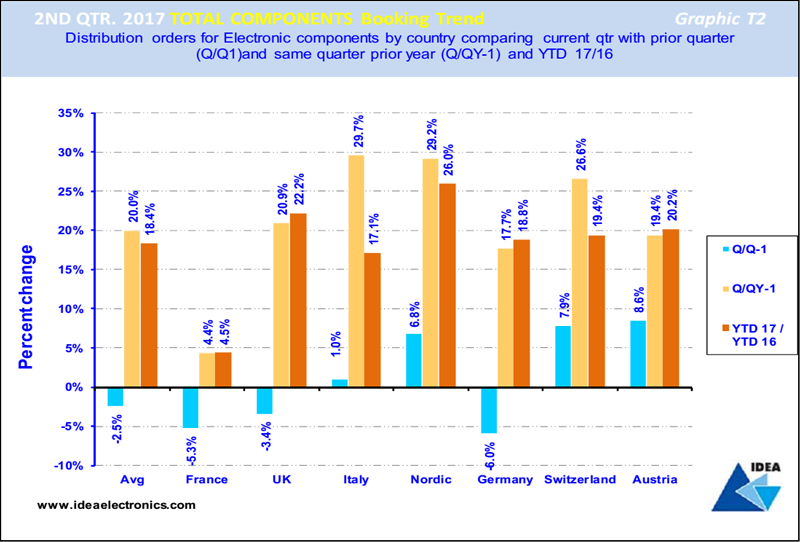
Graphic T2 compares total electronic components bookings (net new orders entered) by each country in Europe in Q2 '17 and contrasts and compares the results with the previous quarter's results and those achieved in the same period 2016. The blue bar reveals that there was an average bookings decline within the UK, France and German components markets of 2.5% in Q2, whilst growth continued in the remaining countries.
The light brown bar compares Q2 '17 with the same quarter last year and indicates that all European electronic components markets enjoyed strong bookings in the quarter, averaging out at 20% growth. The dark brown bar compares and contrasts bookings achieved Y2D with the same period last year and illustrates an average bookings growth rate of 18.4%.over the 12 months.
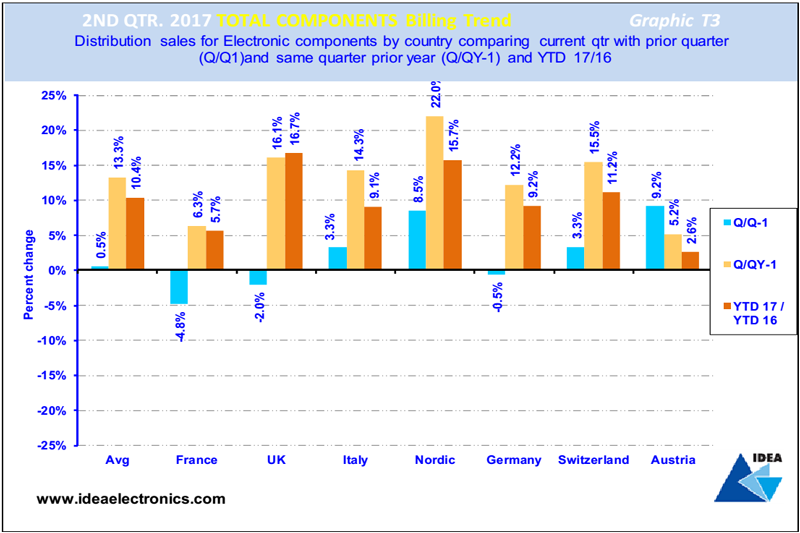
Graphic T3 illustrates total electronic components billings (sales revenue invoiced, less credits) achieved in Europe in Q2 '17. The blue bar compares this quarter with the previous one and reveals that the UK, France and German components markets declined in the period whilst the other countries continued to grow. Overall, the average change was 0.5% growth. The light brown bar compares Q2 with the same quarter last year and shows that all European electronic components markets experienced strong billings growth with an average growth rate of 13.3%.
The dark brown bar compares the current year to date billings with the same period last year and shows an average billings growth rate over the 12 month period of 10.4%.
Product Spotlight
APV1111GVY
Panasonic

Panasonic PhotoMOS® Photovoltaic MOSFET High-Power Drivers
| SKU: | |
|---|---|
| Stock: | 3490 |
| Cost: | $3.95 |
