
European electronic components market trends – Q1 2018
The European electronic components distributor total available market (DTAM) continued to grow in Q1 2018 with members of the International Distributors of Electronics Association (IDEA) reporting Billings growth of seven percent when compared to the same calendar quarter 2017.
These figures are the latest in a period of continuous growth spanning 19 calendar quarters and an ongoing period of double digit growth going back to Q4 2015. IDEA members are upbeat about the immediate future and believe that the European electronic components market will continue to grow throughout 2018/19 but at a slightly lower pace, and until capacity increases extended manufacturer lead times will probably affect availability of all electronic components.
IDEA uses three primary metrics in its reporting process: ‘Bookings’ (net new orders entered), ‘Billings’ (sales revenue invoiced, less credits) and the ratio of the two, known as the ‘Book to Bill’ (or B2B) ratio. According to IDEA chairman Adam Fletcher, all three metrics are important but the ‘Billings’ number is possibly the most critical value: “It’s the most accurate indicator of the performance of all organisations operating in the market,” said Fletcher, “organisations are able to use the ‘Billings’ figures to compare their actual operating performance with the market’s average sales revenue performance.”
The data presented in the following graphics is shown in Euros and where necessary has been converted from local currency at a fixed exchange rate for the year.
Q1 2018 Bookings, Billings & B2B - Graphic T1
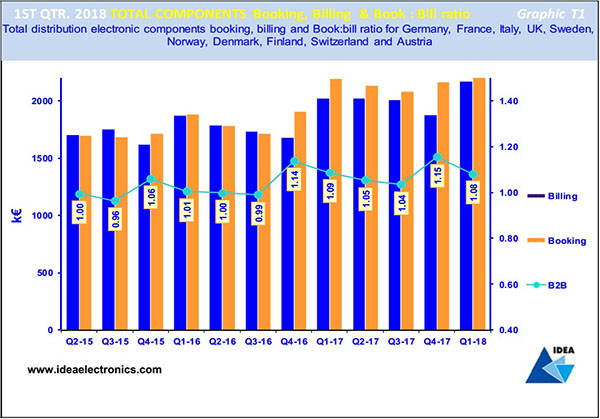
The blue bars in Graphic T1 show Q1 2018 Billings growth of 15% when compared to the previous quarter and seven percent growth compared to the same period in 2017. The brown bars show that Bookings grew by eight percent in Q1 2018 when compared to the previous quarter and seven percent Bookings growth compared to the same quarter 2017.
The decline in the book-to-bill (B2B) ratio over the first three quarters of 2017 from - 1.09:1 down to 1.04:1 – indicated that Billings growth would slow into Q4, which in the event proved to be true. However, the 1.15:1 B2B ratio reported for Q4 2017 suggests optimism that Billings growth would probably increase as we moved into Q1 2018, which it duly did. Whilst welcome, this stronger than average growth performance is much in-line with broad historical industry trends for the first quarter of the year.
Q1 2018 Bookings Trend - Graphic T2
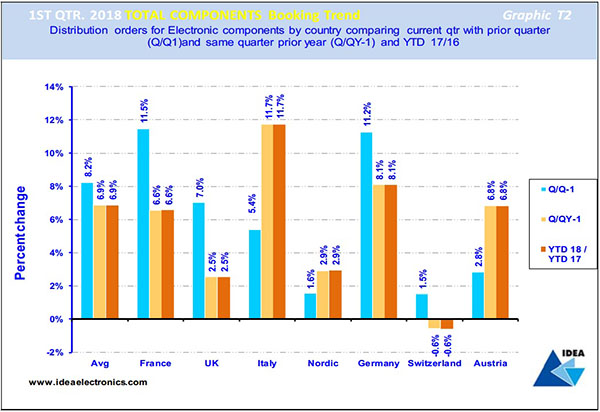
Graphic T2 compares the total electronic components Bookings achieved in each country in Europe in Q1 2018 and contrasts and compares the results with the previous quarter's results and those achieved in the same period last year.
The blue bar reveals that in Q1 2018 Bookings in the French and German components markets increased faster than the European average of eight percent growth when compared to the previous quarter.
The light brown bar compares Q1 2018 with the same quarter in 2017 and indicates that Bookings growth in the Italian and Germany components markets increased faster than the European average of seven percent in the period. However, all European electronic components markets enjoyed strong Bookings growth in Q1, averaging out at 13.6%.
The dark brown bar compares Bookings achieved year-to-date (Y2D) with the same period in 2017, revealing an average Bookings growth rate of seven percent over the 12-month period. Note that the Italian and German markets grew faster than the European average.
Q1 2018 Billings Trend - Graphic T3
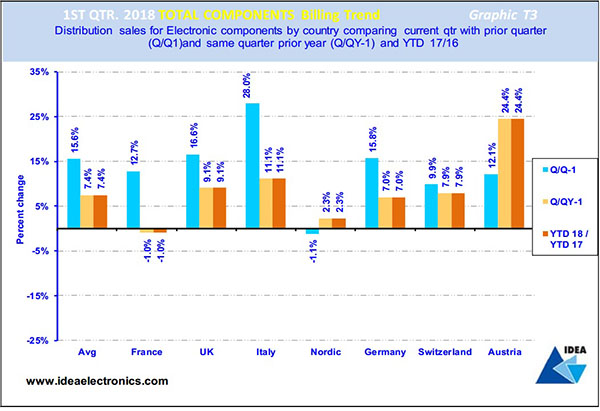
Graphic T3 illustrates the total electronic components Billings achieved in Europe in Q1 2018 and contrasts and compares the results with the previous quarter's results and those achieved in the same quarter 2017.
The blue bars compare Q1 2018 Billings with the preceding quarter’s figures revealing that the UK, Italian and German electronic components markets grew faster than the European average of 15% in the period, with the French, Nordic and Swiss markets returning Billings growth well below the average compared to the previous quarter,
The light brown bars compare Q1 2018 Billings with the same quarter in 2017 and show that growth in the UK, Italian, Swiss and Austrian electronic components market increased faster than the European average of seven percent, with Germany just below the average and the French and Nordic region well below.
The dark brown bars compare the current year-to-date Billings with the same period in 2017, revealing that the UK, Italian, Swiss and Austrian components market grew faster than the European average of seven percent growth, with Germany just below the average and the French and Nordic region well below.
Product Spotlight
APV1111GVY
Panasonic

Panasonic PhotoMOS® Photovoltaic MOSFET High-Power Drivers
| SKU: | |
|---|---|
| Stock: | 3490 |
| Cost: | $3.95 |
