
Order from Chaos
There isn't much more frustrating than trying to root cause a problem with an app running on a large, multi-process server?
Guest blog by Ron Breault.
Unless the problem is doing the same when the server is running OpenStack, notorious for generating cryptic logs, well now imagine this challenge of doing the same when the app might span or migrate across 100 servers and runs virtualised in its own VM.
The life of a cloud operator can be downright nasty at times.
Thankfully, if you’re responsible for running Wind River Titanium Cloud, there are some incredibly powerful and intelligent tools on hand to make your job easier and more effective.
In addition to the rich set of features which are covered previously (orchestrated patching, in-service release-to-release upgrades, network troubleshooting), Titanium Cloud delivers with an integrated, pre-configured log analytics sample tool based on the open source ELK stack (Elastic Search, Logstash and Kibana).
Production clouds span dozens to hundreds of nodes – and growing. Each of those nodes constantly generates a real-time flow of system logs, from debug and error message, to security notices and information updates. Some logs are generated by the host operating system, and some by system services (e.g. databases, webservers); many others are generated by the various projects comprising OpenStack (Nova, Cinder, Keystone, Ceph, etc.).
Without some form of expert system, trying to trace a particular problem impacting cloud services is literally like finding a needle in a haystack. Depending on the size of the cluster and its workload, hundreds of thousands of logs might exist across all those nodes.
Working to root cause problems will typically involve having to search through logs on each node, file by file, as a problem one server more often than not have some impact on other servers. Where did the problem originate? At what time? How long did it last? Which problems are simply ‘noise’- secondary issues resulting from the root cause issue – and which point to the original problem?
The sample version of the ELK tool is bundled into the Titanium Cloud SDK, delivered to all Titanium Cloud customers. Running a simple script provided, operators can choose to install ELK onto a dedicated bare metal server, or it can just as easily be deployed into a VM itself. Once installed and set-up, ELK receives, consolidates, categorises, filters and sorts all of the logs from each of the servers, all in real-time, 7×24 in the background.
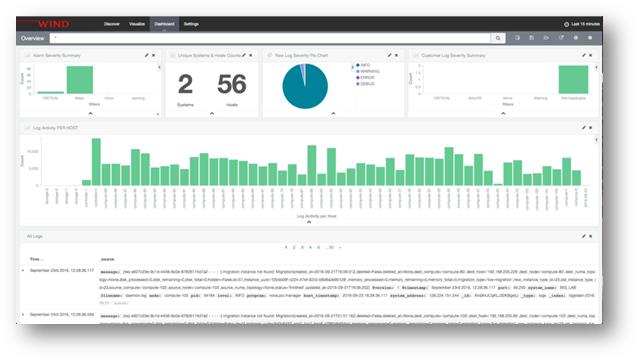
Using the interactive and intuitive ELK GUI, operators investigating problems are presented with a variety of visualisations to help conceptualise all of the complex data collected. ELK offers its users a rich set of options to help analyse the data, zooming on specific nodes, devices, over particular time periods, or looking for specific key words. In fact, there are so many different and powerful ways to investigate problems using ELK that the system has its own ‘dashboard’ definition facility. This lets users create and save customised search criteria depending on their needs.
To further help operators, ELK for Titanium Cloud comes preconfigured with a set of handcrafted dashboards which the Wind River team feels are a perfect start for new Titanium Cloud installations. To the people who really needs these tools, this is a bright light in a dark room.
Think of ELK as your virtual assistant who helps you root cause system problems in minutes instead of hours; it brings you order when you need it most. Words alone don’t convey the full power and ease of use of this well-engineered, well respected tool.
Courtesy of Wind River.
Product Spotlight
APV1111GVY
Panasonic

Panasonic PhotoMOS® Photovoltaic MOSFET High-Power Drivers
| SKU: | |
|---|---|
| Stock: | 3490 |
| Cost: | $3.95 |
